Measure Overview
Use in CMS Programs
- Finalized in the Long-Term Care Hospital Quality Reporting in 2017.
- Implemented in the Long-Term Care Hospital Quality Reporting in 2019.
Description
This measure assesses facility-level compliance with Spontaneous Breathing Trial (SBT), including Tracheostomy Collar Trial (TCT) or Continuous Positive Airway Pressure (CPAP) breathing trial, by Day 2 of the Long-Term Care Hospital (LTCH) stay for patients on invasive mechanical ventilation support upon admission, and for whom at admission weaning attempts were expected or anticipated at admission. This measure will be computed and reported separately according to each of the following components:
- Component 1: Percentage of LTCH Stays in Which Patients Were Assessed for Readiness for SBT by Day 2 of the LTCH Stay
- Component 2: Percentage of LTCH Stays in Which Patients Were Ready for SBT Who Received SBT by Day 2 of LTCH Stay.
Measure Specification
Component 1: LTCH stays in which patients are admitted on invasive mechanical ventilation for whom the LTCH Admission assessment (A0250 = [01]) indicates:
- Completed assessment for readiness for SBT by day 2 of the LTCH stay (O0150B = [1] (yes)) and were either deemed medically ready (O0150C = [1] (yes)) OR
- Medically unready, with documentation of reason(s) (O0150D = [1](Yes)).
Component 2: LTCH stays in which patients are admitted on invasive mechanical ventilation for whom the LTCH Admission assessment (A0250 = [01]) indicates SBT performed by day 2 of the LTCH stay (O0150E = [1](yes)).
N/A
N/A
Component 1: LTCH stays in which patients who were on invasive mechanical ventilation support upon admission to an LTCH, for whom weaning attempts are expected or anticipated (for LTCH stays with admission date from 07/01/2018 through 09/30/2022: O0150A = [1] (yes, on weaning); for LTCH stays with admission date on and after 10/01/2022: O0150A = [1] (yes, on ventilation) and O0150A2 = [1] (yes, weaning)).
Component 2: The subset of LTCH stays in which patients in the numerator of Component 1 were assessed and deemed ready for SBT by Day 2 of the LTCH stay (O0150B = [1] (yes) and O0150C = [1] (yes)).
LTCH stay is excluded from both Component 1 and Component 2 if:
1. LTCH stay is missing data to calculate the measure (for LTCH stays with admission date from 07/01/2018 through 09/30/2022: O0150A = [-]; for stays with admission date on and after 10/01/2022: O0150A = [-] or O0150A2 = [-]), OR
2. LTCH stays in which weaning attempts are not expected or anticipated at admission for the patient (for LTCH stays with admission date from 07/01/2018 through 09/30/2022: O0150A = [0] (No, not invasive mechanical ventilation support), or O0150A = [2] (Yes, non-weaning); for LTCH stays with admission date on and after 10/01/2022: O0150A = [0] (No, not invasive mechanical ventilation support), or O0150A = [1] and O150A2 = [0] (Yes, non-weaning)).
N/A
Measure Information
Endorsement History
N/A
Measure Performance in Program
Measure Score by Performance Year
Impact Summary: This measure supports the Long‑Term Care Hospital (LTCH) Quality Reporting Program goal of measuring and improving the quality of care provided in long‑term care hospitals by assessing LTCH compliance with timely spontaneous breathing trials for patients on mechanical ventilation, a key clinical practice that informs ventilator management, supports care coordination, and improves outcomes for medically complex patients with prolonged hospital stays.
Hospital performance has stayed steady for Component 1 from 2023 to 2024 and increased slightly for Component 2 from 2023 to 2024. For Component 1, the measure identified 23,000 eligible patients assessed for readiness for SBT. Improving performance among lower-scoring hospitals could help ensure about 1,100 patients are assessed for readiness, or about four per entity, potentially leading to better health outcomes. For Component 2, the measure identified 19,100 eligible patients assessed for readiness for SBT. Improving performance among lower-scoring hospitals may help less than two patients per entity; therefore, a benefit may not exceed the entity-level burden of quality data collection.
For this measure, Battelle reviewed the following publicly available datasets available at Long-Term Care Hospital - Provider Data | Provider Data Catalog (cms.gov):
- long-term_care_hospitals_03_2026.zip (which contains data from April 2024-March 2025 and is referred to as year 2024 in this assessment)
- long-term_care_hospitals_03_2025.zip (which contains data from April 2023-March 2024 and is referred to as year 2023 in this assessment)
Battelle analyzed all values for “L_022_02” not marked as “Not Available” from the corresponding Long-term_Care_Hospital-Provider_Data.csv file. We analyzed rates for Component 1 and Component 2 separately.
About Figure 1: Figures 1a and 1b are boxplots that show how scores have changed based on the most recent 2 years of data available. For each year, the boxplot displays a box with lines and dots to help visualize the range and distribution of scores. The dots represent the points where the lowest 5% and highest 5% of scores fall, and the line connecting them shows where 90% of the scores are located. The box itself covers the middle half of the scores, from the 25th to the 75th percentile. Inside the box, a horizontal line marks the median score, which is the middle value, while a “+” sign shows the average score. This type of graph makes overall trends in scores over time as well as the consistency and spread of the results easier to understand.
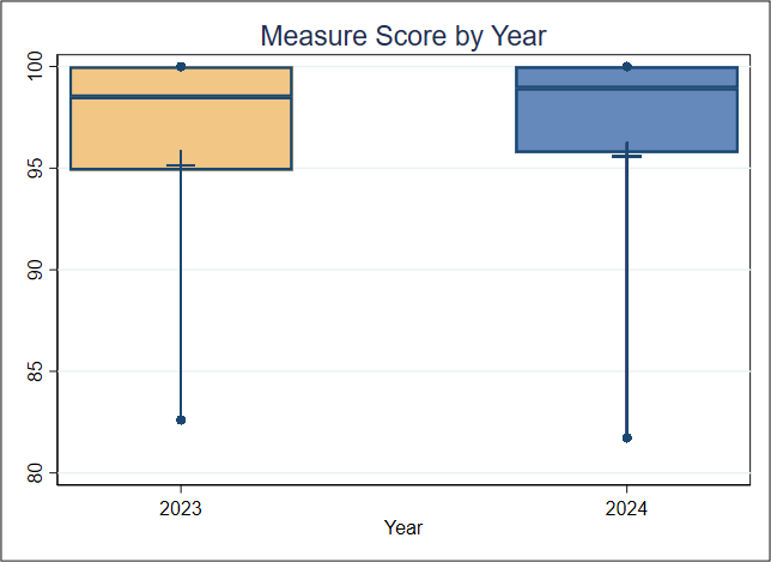
Figure 1a. Boxplot of Measure Performance Rate by Year (Component 1)
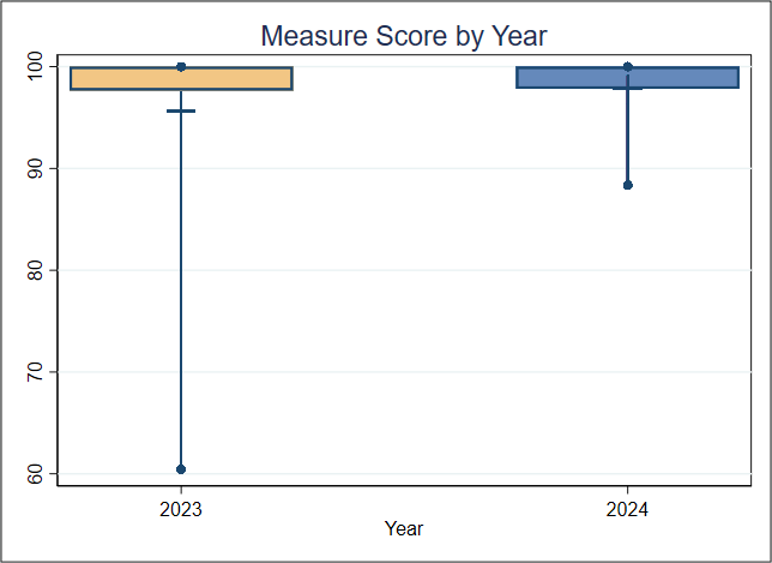
Figure 1b. Boxplot of Measure Performance Rate by Year (Component 2)
Figure 1a and 1b Interpretation: Figure 1a shows little discernible change between 2023 and 2024. Although the median value for Component 2 is 100% for both years, in Figure 1b the mean value increases slightly from 95.6% in 2023 to 97.8% in 2024. The mean in 2023 was lower because about 5% of the entities had a score of less than 60% whereas only one entity had a performance rate less than 60% in 2024. For these measures, a higher performance rate indicates better quality of care.
Score Distribution for Most Recent Years
About Table 1: Tables 1a and 1b illustrate the distribution of performance rates and the population represented within each group for each component. It is important to note that the groups (referred to as deciles, each comprising 10% of the organizations) with the lowest or highest rates may contain smaller or larger populations than other groups. For example, if the lowest-scoring decile includes only 5% of the total population, then smaller group size may be associated with lower performance rates.
Table 1a. Importance (Decile by Measure Performance Rate, 2024) in the Most Recent Year of Data Available – Component 1
| Overall | Decile 1 | Decile 2 | Decile 3 | Decile 4 | Decile 5 | Decile 6 | Decile 7 | Decile 8 | Decile 9 | Decile 10 | |
| Average Score (Standard Deviation) | 95.6 (11.3) | 72.5 | 92.7 | 95.8 | 97.4 | 98.4 | 99.4 | 100 | 100 | 100 | 100 |
| Entities | 264 | 27 | 26 | 27 | 26 | 26 | 27 | 26 | 27 | 26 | 26 |
| Patients | 24,059 | 2,416 | 2,354 | 2,523 | 2,183 | 3,003 | 4,291 | 1,820 | 1,815 | 1,924 | 1,730 |
Table 1b. Importance (Decile by Measure Performance Rate, 2024) in the Most Recent Year of Data Available – Component 2
| Overall | Decile 1 | Decile 2 | Decile 3 | Decile 4 | Decile 5 | Decile 6 | Decile 7 | Decile 8 | Decile 9 | Decile 10 | |
| Average Score (Standard Deviation) | 97.8 (5.6) | 84.9 | 96.1 | 97.9 | 99.4 | 100 | 100 | 100 | 100 | 100 | 100 |
| Entities | 246 | 25 | 25 | 24 | 25 | 24 | 25 | 25 | 24 | 25 | 24 |
| Patients | 19,540 | 2,018 | 1,815 | 1,821 | 3,008 | 1,565 | 1,940 | 2,395 | 1,758 | 1,650 | 1,570 |
Table 1a and 1b Interpretation: To estimate the number of positive outcomes, the number of patients is multiplied by the average rate for each decile. In 2024, for Component 1, the total estimated number of positive outcomes (eligible patients assessed for readiness for SBT) across all deciles is about 23,000. If the average performance of decile 8 (100%) is considered a plausible, achievable score, and the entities in deciles 1 through 7 improved to reach that score, about 1,000 additional positive outcomes could occur. This translates to about four patients per entity and means that improving performance on this measure could help ensure that several hundred more patients are assessed for readiness, potentially leading to better health outcomes. For Component 2, the total estimated number of positive outcomes (eligible patients who received SBT) across all deciles is about 19,100. If the average performance of decile 8 (100%) is considered a plausible, achievable score, and the entities in deciles 1 through 7 improved to reach that rate, about 400 additional patients would receive SBT, which translates to less than two patients per entity.
Meaningfulness
Importance
The Meaningfulness criterion will be evaluated as part of the full Preliminary Assessment available in September.
Data Stream Burden Reduction
Data Stream Burden Reduction
This criterion will be evaluated as part of the full Preliminary Assessment available in September.
Alignment with the Patient Health Care Journey
Alignment with the Patient Health Care Journey
This criterion will be evaluated as part of the full Preliminary Assessment available in September.
Public Comment
Enter a comment below