
Measure Overview
Use in CMS Programs
- Finalized in the Inpatient Rehabilitation Facility Quality Reporting in 2013
- Implemented in the Inpatient Rehabilitation Facility Quality Reporting in 2015
- This measure also has active program-variants in Hospital Inpatient Quality Reporting, Long-Term Care Hospital Quality Reporting, Skilled Nursing Facility Quality Reporting, and Prospective Payment System-Exempt Cancer Hospital Quality Reporting
Description
This measure identifies the percentage of healthcare personnel who receive the influenza vaccination among the total number of healthcare personnel (HCP) in the facility for at least one working day between October 1 and March 31 of the following year, regardless of clinical responsibility or patient contact.
Measure Specification
The numerator for this measure consists of HCP in the denominator population, who fall into one of the categories below. HCP should be counted as vaccinated if they receive influenza vaccine any time from when it first became available, such as August or September, through March 31 of the following year.
- Received an influenza vaccination administered at the healthcare facility.
- Reported in writing (paper or electronic) or provided documentation that influenza vaccination was received elsewhere.
- Determined to have a medical contraindication/condition of severe allergic reaction to eggs or other component(s) of the vaccine, or history of Guillain-Barre Syndrome (GBS) within 6 weeks after a previous influenza vaccination.
- Offered but declined influenza vaccination.
- Had an unknown vaccination status or did not otherwise meet any of the definitions of the other numerator categories.
N/A
N/A
The denominator for this measure consists of healthcare personnel (HCP) who are physically present in the healthcare facility for at least 1 working day between October 1 through March 31 of the following year. Denominators are to be calculated separately for three required categories of HCP and can also be calculated for a fourth optional category:
- Employees (required): This includes all persons receiving a direct paycheck from the reporting facility (i.e., on the facility's payroll), regardless of clinical responsibility or patient contact.
- Licensed independent practitioners (LIPs) (required): This includes physicians (MD, DO), advanced practice nurses, and physician assistants who are affiliated with the reporting facility, but are not directly employed by it (i.e., they do not receive a paycheck from the facility), regardless of clinical responsibility or patient contact. Post-residency fellows are also included in this category if they are not on the facility's payroll.
- Adult students/trainees and volunteers (required): This includes medical, nursing, or other health professional students, interns, medical residents, or volunteers aged 18 or older who are affiliated with the healthcare facility, but are not directly employed by it (i.e., they do not receive a paycheck from the facility), regardless of clinical responsibility or patient contact.
- Other contract personnel (optional): Contract personnel are defined as persons providing care, treatment, or services at the facility through a contract who do not fall into any of the other denominator categories. Please note this also includes vendors providing care, treatment, or services at the facility who may or may not be paid through a contract. Reporting for this category is currently optional.
None
N/A
Measure Information
Endorsement History
- Initial endorsement in 2008 and retained endorsement during maintenance review in 2022
Link to Endorsement Measure Record: Influenza Vaccination Coverage Among Healthcare Personnel
Measure Performance in Program
Measure Score by Performance Year
Impact Summary: This measure supports the Inpatient Rehabilitation Facility Quality Reporting Program’s goal of improving the quality of inpatient rehabilitation care by assessing whether facilities implement a core infection-prevention practice, health care personnel influenza vaccination, to support safer care environments for patients receiving rehabilitation services.
Rehabilitation facility performance has steadily decreased from 2020 to 2024, indicating lower vaccination among HCP. Improving performance among lower-scoring facilities could help ensure 52,000 additional HCP receive influenza vaccinations or about 46 health care personnel per entity.
For this measure, Battelle reviewed the following publicly available datasets available at Inpatient Rehabilitation Facility - Provider Data | Provider Data Catalog (cms.gov):
- Inpatient_rehabilitation_facilities_03_2026.zip (which contains data from October 2024-March 2025 and is referred to as year 2024 in this assessment)
- Inpatient_rehabilitation_facilities_03_2025.zip (which contains data from October 2023-March 2024 and is referred to as year 2023 in this assessment)
- Inpatient_rehabilitation_facilities_03_2024.zip (which contains data from October 2022-March 2023 and is referred to as year 2022 in this assessment)
- Inpatient_rehabilitation_facilities_03_2023.zip (which contains data from October 2021-March 2022 and is referred to as year 2021 in this assessment)
- Inpatient_rehabilitation_facilities_12_2022.zip (which contains data from October 2020-March 2021 and is referred to as year 2020 in this assessment)
Battelle analyzed all values for “I_016_01” not marked as “Not Available” from the corresponding Inpatient_Rehabilitation_Facility-Provider_Data.csv file.
About Figure 1: Figure 1 is a boxplot that shows how scores have changed based on the most recent 5 years of data available. For each year, the boxplot displays a box with lines and dots to help visualize the range and distribution of scores. The dots represent the points where the lowest 5% and highest 5% of scores fall, and the line connecting them shows where 90% of the scores are located. The box itself covers the middle half of the scores, from the 25th to the 75th percentile. Inside the box, a horizontal line marks the median score, which is the middle value, while a “+” sign shows the average score. This type of graph makes overall trends in scores over time as well as the consistency and spread of the results easier to understand.
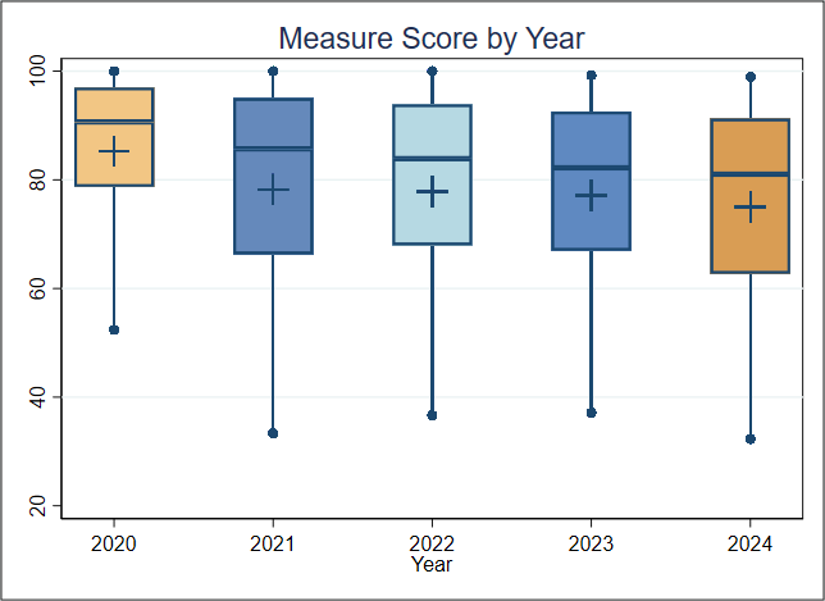
Figure 1. Boxplot of Measure Score by Year
Figure 1 Interpretation: Figure 1 shows a steady drop from a median value of nearly 91% in 2020 to a median value of 81% in 2024. For this measure, a higher score indicates better quality of care.
Score Distribution for Most Recent Years
About Table 1: Table 1 illustrates the distribution of scores and the population represented within each group. It is important to note that the groups (referred to as deciles, each comprising 10% of the organizations) with the lowest or highest scores may contain larger or smaller populations than other groups. For example, if the lowest-scoring decile includes only 5% of the total population, then smaller group size may be associated with lower performance scores.
Table 1. Importance in the most recent year of data available (Decile by Measure Score, 2024)
| Overall | Decile 1 | Decile 2 | Decile 3 | Decile 4 | Decile 5 | Decile 6 | Decile 7 | Decile 8 | Decile 9 | Decile 10 | |
| Average Score (Standard Deviation) | 75.0 (21.0) | 29.5 | 51.6 | 63.0 | 72.2 | 78.3 | 83.3 | 87.5 | 91.2 | 95.0 | 98.7 |
| Entities | 1,118 | 112 | 112 | 112 | 112 | 111 | 112 | 112 | 112 | 112 | 111 |
| Population | 347,271 | 29,741 | 24,704 | 31,636 | 35,266 | 29,770 | 42,247 | 31,435 | 45,983 | 30,212 | 46,277 |
Table 1 Interpretation: To estimate the number of positive outcomes (influenza vaccinations for health care personnel), the population is multiplied by the average score for each decile. Right now, the total estimated number of positive outcomes across all deciles is about 270,000. If the average performance score of Decile 8 (91.2%) is considered a plausible, achievable score, and the entities in Deciles 1 through 7 improved to reach that score, about 52,000 additional positive outcomes could occur. This translates to about 46 health care personnel per entity and means that improving performance on this measure could help ensure that tens of thousands more health care workers receive influenza vaccinations, potentially leading to better health outcomes.
Meaningfulness
Importance
The Meaningfulness criterion will be evaluated as part of the full Preliminary Assessment available in September.
Data Stream Burden Reduction
Data Stream Burden Reduction
This criterion will be evaluated as part of the full Preliminary Assessment available in September.
Alignment with the Patient Health Care Journey
Alignment with the Patient Health Care Journey
This criterion will be evaluated as part of the full Preliminary Assessment available in September.
Public Comment
Lacks correlation with other measures of quality
Better performance on the Influenza Vaccination Coverage Among Healthcare Personnel measure is not highly correlated with other IRF quality measures, such as discharge to community or discharge function score. For example, for the 45 IRFs who have a 100% Influenza Vaccination among HCP rate in the June 2026 Care Compare refresh, the Discharge to Community risk-standardized rates range from 57.99% to 74.04% (compared to a national average value of 67.39%), while the Discharge Function scores range from 12.14% to 87.94% (compared to a national average value of 66.02%). This suggests that the highest performance on the Influenza Vaccination among HCP measure does not clearly indicate higher quality, especially when it comes to returning patients to their home or community setting or discharging patients at expected functional status levels.
AMRPA also notes that national vaccination rates have declined in recent years and the variations in vaccination rates by state also question whether higher values are truly representative of better quality.
AMRPA asks that this measure be removed from endorsement and/or removed from the IRF QRP until such a time as the measure is updated to become better correlated with other quality measures or have consideration for national or state-level vaccination rates.
The Federation of American…
The Federation of American Hospitals believes that the MSR should review the appropriateness of continuing to include this measure in the Hospital Inpatient Rehabilitation Facility Quality Reporting Program. Specifically, we do not believe that the burden of data collection outweighs the benefits for this measure.