Measure Overview
Use in CMS Programs
- Finalized for inclusion in the Long-Term Care Hospital Quality Reporting Program in 2011.
- Implemented in the Long-Term Care Hospital Quality Reporting Program in 2013.
- Also active in the PPS-Exempt Cancer Hospital Quality Reporting (PCHQR) Program.
Description
Annual risk-adjusted standardized infection ratio (SIR) of central line-associated bloodstream infections (CLABSI) among adults and children hospitalized as inpatients at acute care hospitals, critical access hospitals, oncology hospitals, and long-term acute care hospitals. SIR is reported annually and is calculated by dividing the number of observed CLABSIs by the number of predicted CLABSIs.
Measure Specification
Number of annually observed central line-associated bloodstream infections (CLABSI) in hospital inpatients.
N/A
N/A
Number of annually predicted central-line associated bloodstream infections (CLABSI) in hospital inpatients.
The following devices are not considered central lines and are excluded:
- Arterial catheters unless in the pulmonary artery, aorta or umbilical artery
- Arteriovenous fistula
- Arteriovenous graft
- Extracorporeal life support (ECMO)
- Hemodialysis reliable outflow (HERO) dialysis catheter
- Intra-aortic balloon pump (IABP) devices
- Peripheral IV or Midlines
- Ventricular Assist Device (VAD)
CLABSI events reported to NHSN as mucosal barrier injury laboratory-confirmed bloodstream infections (MBI-LCBIs) are excluded.
N/A
Measure Information
Endorsement History
Endorsement History:
- The measure was first endorsed in 2012.
- Measure retained endorsement in 2025 through maintenance cycle as new measure ID CBE #0139.
Link to Endorsement Measure Record: Catheter-Associated Urinary Tract Infection (CAUTI) Standardized Infection Ratio | Partnership for Quality Measurement
Measure Performance in Program
Measure Score by Performance Year
Impact Summary: This measure supports the Long-Term Care Hospital Quality Reporting Program by assessing health care–associated central line–associated bloodstream infections (CLABSIs) among patients in long-term care hospitals, an outcome closely associated with patient safety and infection prevention.
Based on the most recent data, the total estimated number of CLABSIs across all deciles is approximately 1,200. If long-term care hospitals with higher CLABSI rates improved their performance to levels observed among better-performing facilities, the analysis suggests that up to about 1,000 CLABSIs could potentially be avoided, indicating a substantial opportunity for improved patient outcomes.
For this measure, Battelle reviewed the following publicly available datasets available at Long-Term Care Hospital - Provider Data | Provider Data Catalog (cms.gov):
- long-term_care_hospitals_03_2026.zip (which contains data from April 2024-March 2025 and is referred to as year 2024 in this assessment)
- long-term_care_hospitals_03_2025.zip (which contains data from April 2023-March 2024 and is referred to as year 2023 in this assessment)
- long-term_care_hospitals_03_2024.zip (which contains data from April 2022-March 2023 and is referred to as year 2022 in this assessment)
- long-term_care_hospitals_03_2023.zip (which contains data from April 2021-March 2022 and is referred to as year 2021 in this assessment)
Battelle analyzed all values for “L_007_01” not marked as “Not Available” from the corresponding Long-term_Care_Hospital-Provider_Data.csv file.
About Figure 1: Figure 1 is a boxplot that shows how scores have changed based on the most recent 4 years of data available. For each year, the boxplot displays a box with lines and dots to help visualize the range and distribution of scores. The dots represent the points where the lowest 5% and highest 5% of scores fall, and the line connecting them shows where 90% of the scores are located. The box itself covers the middle half of the scores, from the 25th to the 75th percentile. Inside the box, a horizontal line marks the median score, which is the middle value, while a “+” sign shows the average score. This type of graph makes overall trends in scores over time as well as the consistency and spread of the results easier to understand.
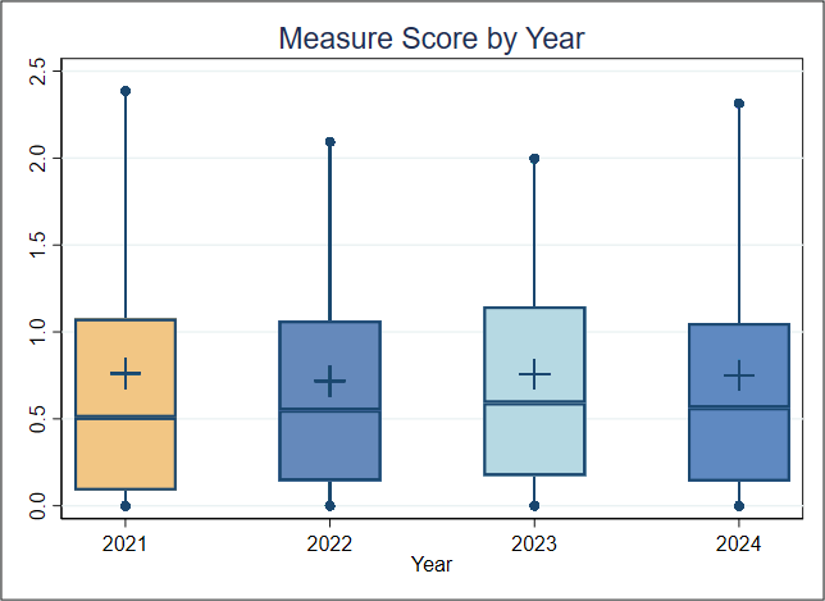
Figure 1. Boxplot of Measure Score by Year
Figure 1 Interpretation: There is little discernible change across the 4 years; the median score ranged between a minimum of 0.51 to a maximum of 0.59. For this measure, a lower score indicates better quality of care.
Score Distribution for Most Recent Years
About Table 1: Table 1 illustrates the distribution of scores (standardized infection ratio [SIR]), raw rates, and the number of patients represented within each group. It is important to note that the groups (referred to as deciles, each comprising 10% of the organizations) with the lowest or highest scores may contain more or fewer patients than other groups. For example, if the lowest-scoring decile includes only 5% of the total patient population, this smaller group size may be associated with lower performance scores.
Table 1. Importance (Decile by Measure Score, FY2024)
| Overall | Decile 1 | Decile 2 | Decile 3 | Decile 4 | Decile 5 | Decile 6 | Decile 7 | Decile 8 | Decile 9 | Decile 10 | |
| Average SIR (Standard Deviation) | 0.750 (0.815) | 0 | 0 | 0.121 | 0.308 | 0.531 | 0.661 | 0.854 | 1.037 | 1.500 | 2.500 |
| Average Raw Rate (Standard Deviation) | 0.090 (0.137) | 0 | 0 | 0.011 | 0.036 | 0.054 | 0.074 | 0.099 | 0.124 | 0.176 | 0.361 |
| Entities | 312 | 32 | 31 | 31 | 31 | 31 | 32 | 31 | 31 | 31 | 31 |
| Patients | 1,230,531 | 100,154 | 69,485 | 131,684 | 142,337 | 125,319 | 153,281 | 129,301 | 150,564 | 109,106 | 119,300 |
Table 1 Interpretation: To estimate the number of negative outcomes (CLABSIs), the number of patients is multiplied by the average raw rate for each decile. In 2024, the total estimated number of negative outcomes across all deciles is about 1,200. If the average performance of Decile 3 (0.011%) is considered a plausible, achievable score, and the entities in Deciles 4 through 10 improved to reach that score, about 1,000 fewer negative outcomes could occur. This translates to about three patients per entity and means that improving performance on this measure could help ensure that several hundred fewer patients contract CLABSIs, potentially leading to better health outcomes.
Meaningfulness
Importance
The Meaningfulness criterion will be evaluated as part of the full Preliminary Assessment available in September.
Data Stream Burden Reduction
Data Stream Burden Reduction
This criterion will be evaluated as part of the full Preliminary Assessment available in September.
Alignment with the Patient Health Care Journey
Alignment with the Patient Health Care Journey
This criterion will be evaluated as part of the full Preliminary Assessment available in September.
Public Comment
Enter a comment below