
Measure Overview
Use in CMS Programs
- Finalized for inclusion in the Prospective Payment System-Exempt Cancer Hospital Quality Reporting Program in 2015.
- Implemented in the Prospective Payment System-Exempt Cancer Hospital Quality Reporting Program in 2017.
- Also active in the Long-Term Care Hospital Quality Reporting Program and the Inpatient Rehabilitation Facility Quality Reporting Program.
Description
Annual risk-adjusted standardized infection ratio (SIR) of Clostridioides difficile (CDI) LabID events among adults and pediatrics hospitalized as inpatients at acute care hospitals, oncology hospitals, long-term acute care hospitals, and acute care rehabilitation hospitals. SIR is reported annually and is calculated by dividing the number of observed CDIs into the number of predicted CDIs.
Measure Specification
Number of annually observed Clostridioides difficile (CDI) LabID events in hospital inpatients.
N/A
N/A
Number of annually predicted Clostridioides difficile (CDI) LabID events in hospital inpatients.
Baby based locations such as, neonatal ICU, special care nursery and well-baby nurseries, are excluded from the denominator count. In LDRP locations, moms and babies must each be counted separately (as two patients). Any locations that predominantly house infants, including NICU, SCN, or well-baby locations (for example, nurseries, babies in LDRP) are excluded.
N/A
Measure Information
Endorsement History
Endorsement History: Endorsed with conditions, 2025
Conditions for maintenance review in 3 years, the developer will have: Explored the possibility of using other all-payer data sources to expand the use of patient-level factors in the risk adjustment model and reduce reliance on facility-level factors.
Link to Endorsement Measure Record: Clostridioides difficile (CDI) LabID Event Standardized Infection Ratio
Measure Performance in Program
Measure Score by Performance Year
Impact Summary: By assessing the difference between observed and expected hospital-onset CDI LabID events among inpatients—accounting for facility characteristics such as bed size, academic affiliation, diagnostic method, and patient prevalence—this measure supports PCH goals by giving consumers meaningful, setting-specific quality-of-care data and encouraging hospitals to improve inpatient care quality for Medicare beneficiaries through transparent reporting and benchmarking against best practices.
Overall, the limited number of PPS-exempt cancer hospitals participating and reporting in this program makes it difficult to analyze overall performance trends. Based on the performance shown in Table 1, if all entities reporting performed at least at the average score, improving performance on this measure could help ensure that 11 fewer patients per entity contract CDI, potentially leading to better health outcomes.
For this measure, Battelle reviewed the following publicly available datasets available at Hospitals data archive | Provider Data Catalog:
- Hospitals_02_2026.zip (which contains data from April 2024-March 2025 and is referred to as year 2024 in this assessment)
- Hospitals_02_2025.zip (which contains data from April 2023-March 2024 and is referred to as year 2023 in this assessment)
- Hospitals_01_2024.zip (which contains data from April 2022-March 2023 and is referred to as year 2022 in this assessment)
- Hospitals_01_2023.zip (which contains data from April 2021-March 2022 and is referred to as year 2021 in this assessment)
Battelle analyzed all values for “PCH_26” not marked as “Not Available” from the corresponding PCH_HEALTHCARE_ASSOCIATED_INFECTIONS_HOSPITAL.csv file.
About Figure 1: Figure 1 is a boxplot that shows how scores have changed based on the most recent 4 years of data available. For each year, the boxplot displays a box with lines and dots to help visualize the range and distribution of scores. The dots represent the points where the lowest 5% and highest 5% of scores fall, and the line connecting them shows where 90% of the scores are located. The box itself covers the middle half of the scores, from the 25th to the 75th percentile. Inside the box, a horizontal line marks the median score, which is the middle value, while a “+” sign shows the average score. This type of graph makes overall trends in scores over time as well as the consistency and spread of the results easier to understand.
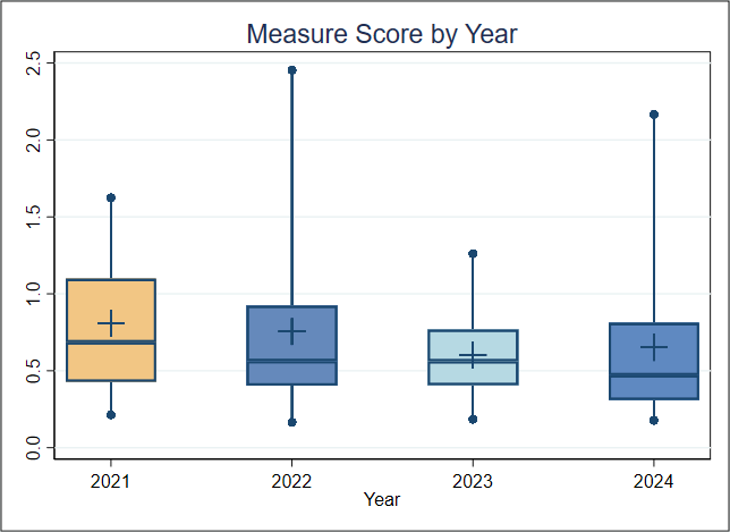
Figure 1. Boxplot of Measure Score by Year
Figure 1 Interpretation: Overall, the limited number of PPS-Exempt Cancer Hospitals participating and reporting in this program makes it difficult to analyze overall performance trends. There are only 11 entities per year, so any apparent trend may just as likely be attributed to random error, indicating little discernible change across the 4 years. For this measure, a lower score indicates better quality of care.
Score Distribution for Most Recent Years
About Table 1: Table 1 illustrates the distribution of scores (standardized infection ratios [SIRs]), raw rates, and the number of patients represented within each group. It is important to note that the groups (referred to as deciles, each comprising 10% of the organizations) with the lowest or highest scores may contain more or fewer patients than other groups. For example, if the lowest-scoring decile includes only 5% of the total patient population, then smaller entity size may be associated with lower performance scores.
Table 1. Importance in the Most Recent Year of Data Available (Decile by Measure Score, FY2024)
| Overall | Decile 1 | Decile 2 | Decile 3 | Decile 4 | Decile 5 | Decile 6 | Decile 7 | Decile 8 | Decile 9 | Decile 10 | |
| Average SIR (Standard Deviation) | 0.652 (0.552) | 0.225 | 0.471 | 0.311 | 0.363 | 0.374 | 0.743 | 0.641 | 0.810 | 2.167 | 0.846 |
| Average Raw Rate (Standard Deviation) | 0.064 (0.040) | 0.026 | 0.030 | 0.038 | 0.043 | 0.043 | 0.062 | 0.089 | 0.091 | 0.105 | 0.148 |
| Entities | 11 | 2 | 1 | 1 | 1 | 1 | 1 | 1 | 1 | 1 | 1 |
| Patients | 806,679 | 325,898 | 23,356 | 10,608 | 121,827 | 170,519 | 6,460 | 17,922 | 76,790 | 6,681 | 46,618 |
Table 1 Interpretation: To estimate the number of negative outcomes (CDI), the number of patients is multiplied by the average raw rate for each decile. In 2024, the total estimated number of negative outcomes across all deciles is about 400. If the average performance of Decile 3 (0.311%) is considered a plausible, achievable rate, and the entities in Deciles 4 through 10 improved to reach that rate, about 120 fewer negative outcomes could occur. This translates to about 11 patients per entity and means that improving performance on this measure could help ensure that fewer patients contract CDI, potentially leading to better health outcomes.
Meaningfulness
Importance
The Meaningfulness criterion will be evaluated as part of the full Preliminary Assessment available in September.
Data Stream Burden Reduction
Data Stream Burden Reduction
This criterion will be evaluated as part of the full Preliminary Assessment available in September.
Alignment with the Patient Health Care Journey
Alignment with the Patient Health Care Journey
This criterion will be evaluated as part of the full Preliminary Assessment available in September.