Measure Overview
Use in CMS Programs
- Finalized through rulemaking for inclusion in the Merit-based Incentive Payment System (MIPS) in 2016.
- Implemented in MIPS starting with Performance Year (PY) 2017.
Description
Percentage of esophageal biopsy reports that document the presence of Barrett’s mucosa that also include a statement about dysplasia.
Measure Specification
Esophageal biopsy report documents the presence of Barrett’s mucosa and includes a statement about dysplasia.
N/A
N/A
All surgical pathology esophageal biopsy reports for Barrett’s Esophagus.
None.
N/A
Measure Information
Endorsement History
N/A
Measure Performance in Program
Measure Score by Performance Year
Impact Summary: This measure evaluates documentation quality for esophageal biopsy reports in the Merit‑based Incentive Payment System (MIPS) by assessing whether reports that identify Barrett’s mucosa also include a statement regarding dysplasia. As a process measure, it supports MIPS goals by encouraging complete and standardized pathology reporting, which contributes to accurate diagnosis and informed clinical management. This measure is subject to the 7-point Cap Removal Benchmark and represents one of the few measures applicable for pathologists within the MIPS set.
Performance has been uniformly high since implementation, with benchmark data indicating that in 2021 and 2022 all reporting clinicians achieved rates greater than 95%. In 2023 and 2024, mean performance remained high, while the distribution of performance rates has widened, with a subset of clinicians reporting rates below 90%.
For this measure, Battelle reviewed the following publicly available datasets at Benchmarks - QPP:
- 2026 MIPS Quality Benchmarks.csv (referred to as year 2024 in this assessment)
- 2025 MIPS Quality Benchmarks.csv (referred to as year 2023 in this assessment)
- 2024 MIPS Quality Benchmarks.csv (referred to as year 2022 in this assessment)
- 2023 MIPS Quality Benchmarks.csv (referred to as year 2021 in this assessment)
Battelle analyzed benchmark values for “Measure_ID”=249 and “Collection Type”= MIPS CQM.
About Figure 1: Figure 1 is a boxplot that shows how rates have changed based on the most recent 4 years of data available. For each year, the boxplot displays a box with lines and dots to help visualize the range and distribution of rates. The dots represent the minimum and maximum rates, and the line connecting them shows the range of the rates. The box itself covers the middle 60% of the rates, from the 20th to the 80th percentile. A “+” sign shows the average rate. This type of graph makes overall trends in rates over time as well as the consistency and spread of the results easier to visualize.
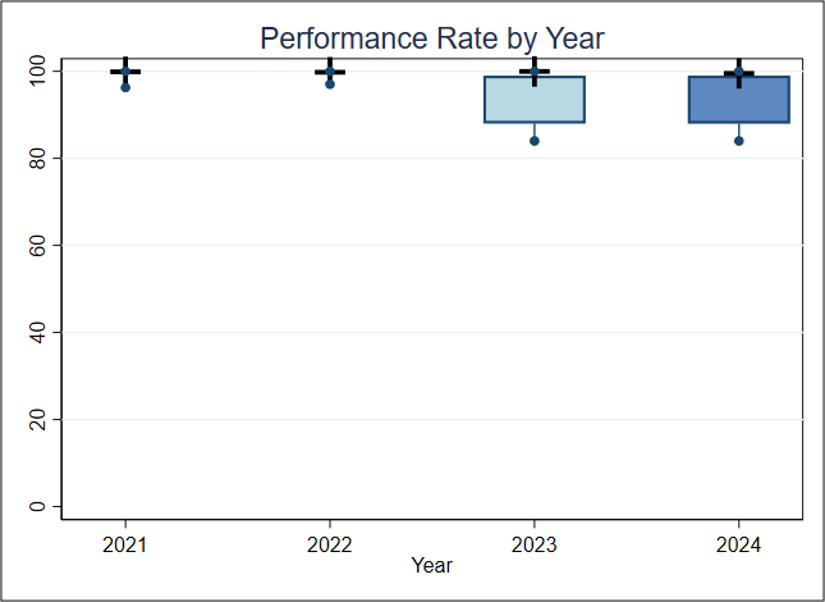
Figure 1. Boxplot of Performance Rate by Year
Figure 1 Interpretation: In 2021 and 2022, all clinicians had a rate higher than 95%; however, in 2023 and 2024, more than 20% of clinicians had a rate less than 90%. Based on information within the benchmark files, it is not possible to determine if this decrease is due to greater variation from more clinicians reporting on the measure in later years or if rates decreased over time within the same clinician population. For this measure, a higher rate indicates better quality of care.
Score Distribution for Most Recent Years
About Table 1: Table 1 illustrates the distribution of rates across deciles in the most recent year of data available.
Table 1. Importance (Decile by Performance Rate, FY2024)
Mean | Decile 1 | Decile 2 | Decile 3 | Decile 4 | Decile 5 | Decile 6 | Decile 7 | Decile 8 | Decile 9 | Decile 10 | |
| Rate | 99.5 | 84.0-86.0 | 86.0-88.0 | 88.0-90.0 | 90.0-92.0 | 92.0-94.0 | 94.0-96.0 | 96.0-98.0 | 98.0-99.0 | 99.0-100 | 100 |
Table 1 Interpretation: Nearly all clinicians have a performance rate greater than 85%, more than 70% of clinicians have a performance rate greater than 90%, and more than 10% of the clinicians have a performance rate of 100%.
Meaningfulness
Importance
The Meaningfulness criterion will be evaluated as part of the full Preliminary Assessment available in September.
Data Stream Burden Reduction
Data Stream Burden Reduction
This criterion will be evaluated as part of the full Preliminary Assessment available in September.
Alignment with the Patient Health Care Journey
Alignment with the Patient Health Care Journey
This criterion will be evaluated as part of the full Preliminary Assessment available in September.
Public Comment
Enter a comment below