Measure Overview
Use in CMS Programs
- Finalized through rulemaking for inclusion in the Merit-based Incentive Payment System (MIPS) in 2016.
- Implemented in MIPS starting with Performance Year (PY) 2017.
Description
Percentage of visits for which the eligible clinician attests to documenting a list of current medications using all immediate resources available on the date of the encounter.
Measure Specification
Eligible clinician attests to documenting, updating, or reviewing the patient's current medications using all immediate resources available on the date of the encounter.
N/A
N/A
All visits occurring during the 12-month measurement period.
None
N/A
Measure Information
Endorsement History
- Initial endorsement, 2008
- Measure retired and endorsement removed, Patient Safety, Spring Cycle 2020
Link to Endorsement Measure Record: Documentation of Current Medications in the Medical Record
Measure Performance in Program
Measure Score by Performance Year
Impact Summary: This measure supports the Merit-based Incentive Payment System (MIPS) goals of improving the quality and safety of care for patients and promoting higher-value care by ensuring clinicians document a current and complete medication list at each visit, which supports accurate clinical decision-making and helps reduce preventable medication errors and adverse drug events.
For the eCQM for this measure, clinician performance remained unchanged from 2021 to 2024, showing consistent documentation of a complete patient medication list. Outliers in clinician performance at the low end of the performance range shown in Figure 1 indicate that some clinicians continue to perform at lower levels and suggest there are still opportunities for improvement. The eCQM identified a medication documentation rate of 99% as achievable; improving performance among lower-scoring clinicians could help ensure 12% more patients have documentation of current medications in their medical record, potentially leading to better health outcomes.
For this measure, Battelle reviewed the following publicly available datasets at Benchmarks - QPP:
- 2026 MIPS Quality Benchmarks.csv (referred to as year 2024 in this assessment)
- 2025 MIPS Quality Benchmarks.csv (referred to as year 2023 in this assessment)
- 2024 MIPS Quality Benchmarks.csv (referred to as year 2022 in this assessment)
- 2023 MIPS Quality Benchmarks.csv (referred to as year 2021 in this assessment)
Battelle analyzed benchmark values for “Measure_ID”=130 and “CMS eCQM ID”=CMS68v15 to generate eCQM benchmark data.
About Figure 1: Figure 1 is a boxplot that shows how rates have changed based on the most recent 4 years of data available. For each year, the boxplot displays a box with lines and dots to help visualize the range and distribution of rates. The dots represent the minimum and maximum rates, and the line connecting them shows the range of the rates. The box itself covers the middle 60% of the rates, from the 20th to the 80th percentile. A “+” sign shows the average rate. This type of graph makes overall trends in rates over time as well as the consistency and spread of the results easier to visualize.
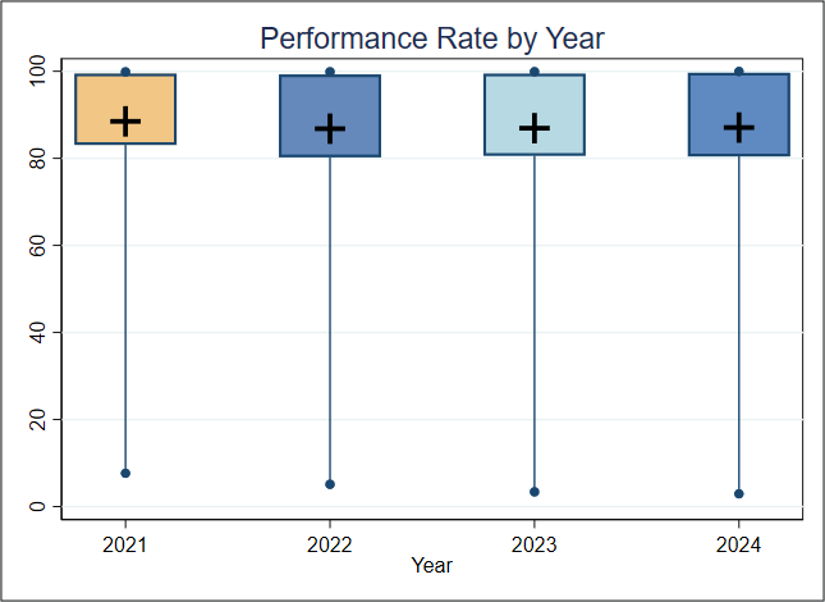
Figure 1. Boxplot of Performance Rate by Year
Figure 1 Interpretation: Performance is virtually unchanged across the 4 years. Each year, there are some clinicians with very low performance, but the 20th percentile has consistently been about 80%. For this measure, a higher rate indicates better quality of care.
Score Distribution for Most Recent Years
About Table 1: Table 1 illustrates the distribution of performance rates across deciles in the most recent year of data available.
Table 1. Importance (Decile by Performance Rate, 2024)
Mean | Decile 1 | Decile 2 | Decile 3 | Decile 4 | Decile 5 | Decile 6 | Decile 7 | Decile 8 | Decile 9 | Decile 10 | |
Rate | 87.1 | 2.9-61.0 | 61.0-80.4 | 80.5-89.0 | 89.0-93.3 | 93.3-96.0 | 96.0-97.8 | 97.8-98.9 | 98.9-99.6 | 99.7-100 | 100 |
Table 1 Interpretation: More than 50% of clinicians have a performance rate greater than 95%, and more than 10% of clinicians have a rate of 100%. If the average performance of Decile 8 (about 99%) is considered a plausible, achievable performance rate, and the clinicians in Deciles 1 through 7 improved to reach that rate, the estimated percentage of patients with documentation of current medications in their medical record would go up by about 12% (from 87.1% to about 99%), potentially leading to better health outcomes.
Meaningfulness
Importance
The Meaningfulness criterion will be evaluated as part of the full Preliminary Assessment available in September.
Data Stream Burden Reduction
Data Stream Burden Reduction
This criterion will be evaluated as part of the full Preliminary Assessment available in September.
Alignment with the Patient Health Care Journey
Alignment with the Patient Health Care Journey
This criterion will be evaluated as part of the full Preliminary Assessment available in September.
Public Comment
Enter a comment below