
Measure Overview
Use in CMS Programs
- Finalized through rulemaking for inclusion in the Merit-based Incentive Payment System (MIPS) in 2016.
- Implemented in MIPS starting with Performance Year (PY) 2017.
Description
Percentage of patients 65 years of age and older who were screened for future fall risk during the measurement period.
Measure Specification
Patients who were screened for future fall risk at least once within the measurement period.
N/A
N/A
Patients aged 65 years and older at the start of the measurement period with a visit during the measurement period.
Exclude patients who are in hospice care for any part of the measurement period.
N/A
Measure Information
Endorsement History
N/A
Measure Performance in Program
Measure Score by Performance Year
Impact Summary: This measure supports the Merit-based Incentive Payment System (MIPS) goals of improving the quality and safety of care for patients and promoting higher‑value care by identifying patients at risk for falls and applying preventative measures.
Clinician performance increased from 2021 to 2024 showing overall improvement; however, the rates were spread evenly across the entire range each year, highlighting the variation in performance each year among reporting clinicians. The analysis suggests that a rate of 98% is achievable relative to the 2024 rate of 67.3%, suggesting a gap in care of about 30%.
For this measure, Battelle reviewed the following publicly available datasets at Benchmarks - QPP:
- 2026 MIPS Quality Benchmarks.csv (referred to as year 2024 in this assessment)
- 2025 MIPS Quality Benchmarks.csv (referred to as year 2023 in this assessment)
- 2024 MIPS Quality Benchmarks.csv (referred to as year 2022 in this assessment)
- 2023 MIPS Quality Benchmarks.csv (referred to as year 2021 in this assessment)
Battelle analyzed benchmark values for “Measure_ID”=318.
About Figure 1: Figure 1 is a boxplot that shows how rates have changed based on the most recent 4 years of data available. For each year, the boxplot displays a box with lines and dots to help visualize the range and distribution of rates. The dots represent the minimum and maximum rates, and the line connecting them shows the range of the rates. The box itself covers the middle 60% of the rates, from the 20th to the 80th percentile. A “+” sign shows the average rate. This type of graph makes overall trends in rates over time as well as the consistency and spread of the results easier to visualize.
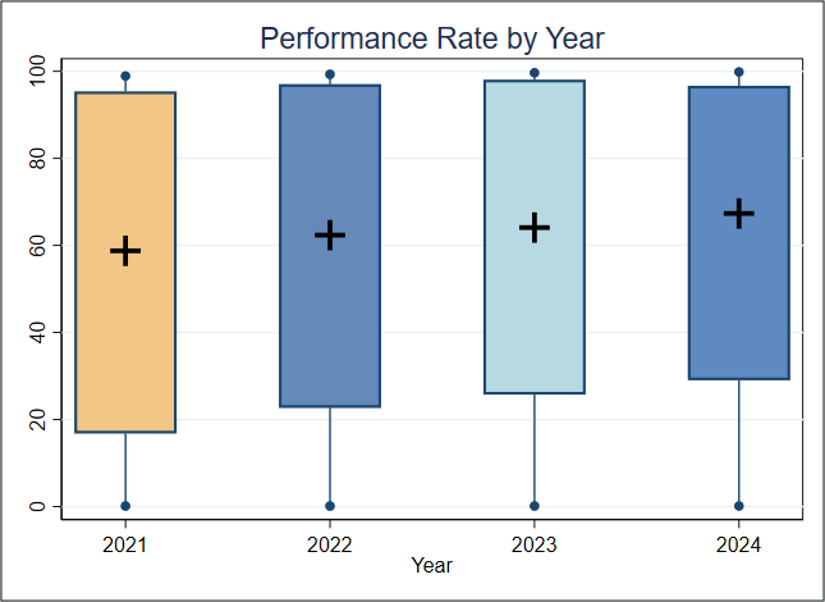
Figure 1. Boxplot of Performance Rate by Year
Figure 1 Interpretation: The rates are spread evenly across the entire range of 0 to 100%. The mean rate increased from 58.76% in 2021 to 67.34% in 2024. The wide spread of performance rates indicates that there is still much variation across clinicians. For this measure, a higher rate indicates better quality of care.
Score Distribution for Most Recent Years
About Table 1: Table 1 illustrates the distribution of rates across deciles for the most recent year of data available.
Table 1. Importance (Decile by Performance Rate, 2024)
Mean | Decile 1 | Decile 2 | Decile 3 | Decile 4 | Decile 5 | Decile 6 | Decile 7 | Decile 8 | Decile 9 | Decile 10 | |
Rate | 67.3 | 0.2-7.9 | 7.9-29.0 | 29.0-50.5 | 50.5-68.0 | 68.0-81.6 | 81.6-90.9 | 90.9-96.7 | 96.7-99.0 | 99.1-99.9 | 99.9-100 |
Table 1 Interpretation: More than 20% of the clinicians have a rate less than 30%, and more than 40% of the clinicians have a rate greater than 90%. If the average performance of Decile 8 (about 98%) is considered a plausible, achievable rate, indicating a performance gap of about 30% (from 67.3% to 98%).
Meaningfulness
Importance
The Meaningfulness criterion will be evaluated as part of the full Preliminary Assessment available in September.
Data Stream Burden Reduction
Data Stream Burden Reduction
This criterion will be evaluated as part of the full Preliminary Assessment available in September.
Alignment with the Patient Health Care Journey
Alignment with the Patient Health Care Journey
This criterion will be evaluated as part of the full Preliminary Assessment available in September.