
Measure Overview
Use in CMS Programs
Measure active in the Inpatient Psychiatric Facility Quality Reporting Program since 2013.
Description
The total number of hours that all patients admitted to a hospital-based inpatient psychiatric setting were held in seclusion.
Measure Specification
The total number of hours that all psychiatric inpatients were held in seclusion.
Numerator Basis: The numerator evaluates the number of hours of seclusion; however, the algorithm calculates the number of minutes to ensure a more accurate calculation of the measure. Convert the minutes to hours when analyzing and reporting this measure.
N/A
N/A
Number of psychiatric inpatient days Denominator basis per 1,000 hours.
Total leave days
N/A
Measure Information
Endorsement History
- Initially endorsed in 2010.
- Maintenance review retained endorsement in 2019.
- Endorsement removed March 31, 2026.
Link to Endorsement Measure Record: HBIPS-3 Hours of seclusion use
Measure Performance in Program
Measure Score by Performance Year
Impact Summary: This measure supports the Inpatient Psychiatric Facility Quality Reporting Program’s goal of improving patient safety and patient experience by measuring the total number of hours that patients admitted to a hospital-based inpatient psychiatric setting were held in seclusion.
Performance has stayed very steady from 2020 to 2024, showing consistent performance among inpatient psychiatric facilities. Table 1 shows data from 2024. The 2024 mean score is largely influenced by higher scores in the top two deciles. If the 407 facilities in decile 3, with an average score of 0, represent a plausible and achievable benchmark, then improvement among facilities in Deciles 4 through 10 toward that benchmark could reduce the estimated rate of seclusion use per 1,000 patient hours and help reduce preventable patient harm associated with excess seclusion in the remaining facilities.
For this measure, Battelle reviewed the following publicly available datasets available at Hospitals data archive | Provider Data Catalog:
- Hospitals_02_2026.zip (which contains data from January 2024-December 2024 and is referred to as year 2024 in this assessment)
- Hospitals_11_2025.zip (which contains data from January 2023-December 2023 and is referred to as year 2023 in this assessment)
- Hospitals_10_2024.zip (which contains data from January 2022-December 2022 and is referred to as year 2022 in this assessment)
- Hospitals_11_2023.zip (which contains data from January 2021-December 2021 and is referred to as year 2021 in this assessment)
- Hospitals_10_2022.zip (which contains data from January 2020-December 2020 and is referred to as year 2020 in this assessment)
Battelle analyzed all values for “HBIPS-3” not marked as “Not Available” from the corresponding IPFQR_QualityMeasures_Facility.csv file.
About Figure 1: Figure 1 is a boxplot that shows how scores have changed based on the most recent 5 years of data available. For each year, the boxplot displays a box with lines and dots to help visualize the range and distribution of scores. The dots represent the points where the lowest 5% and highest 5% of scores fall, and the line connecting them shows where 90% of the scores are located. The box itself covers the middle half of the scores, from the 25th to the 75th percentile. Inside the box, a horizontal line marks the median score, which is the middle value, while a “+” sign shows the average score. This type of graph makes overall trends in scores over time as well as the consistency and spread of the results easier to understand.
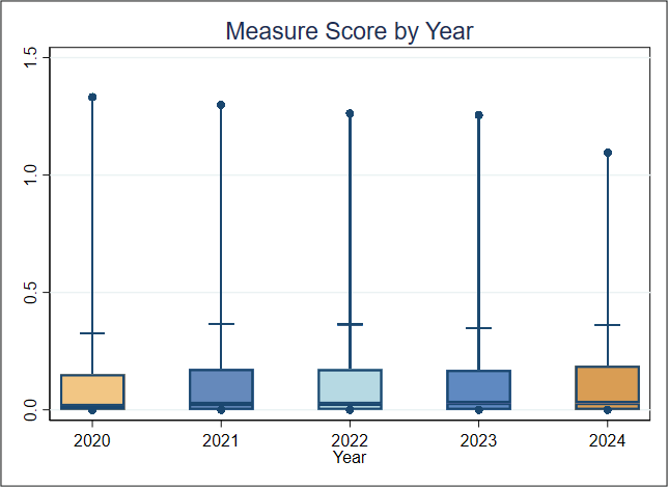
Figure 1. Boxplot of Measure Score by Year
Figure 1 Interpretation: This figure shows that performance has been very consistent across the last 5 years, with no discernible improvement or decrease in overall performance. For this measure, a lower score indicates better quality of care.
Score Distribution for Most Recent Years
About Table 1: Table 1 illustrates the distribution of scores and the number of patient-hours represented within each group in the most recent year with available data. It is important to note that the groups (referred to as deciles, each comprising 10% of the organizations) with the lowest or highest scores may contain more or fewer patients than other groups. For example, if the lowest-scoring decile includes only 5% of the total patient population, then smaller group size may be associated with better performance scores.
Table 1. Importance in the Most Recent Year of Data Available (Decile by Measure Score, 2024)
| Overall | Decile 1 | Decile 2 | Decile 3 | Decile 4 | Decile 5 | Decile 6 | Decile 7 | Decile 8 | Decile 9 | Decile 10 | |
| Average Score (Standard Deviation) | 0.360 (2.006) | 0 | 0 | 0 | 0.002 | 0.017 | 0.047 | 0.102 | 0.188 | 0.386 | 2.871 |
| Facilities | 1355 | 136 | 135 | 136 | 135 | 136 | 135 | 136 | 135 | 136 | 135 |
| Patient-Hours (1,000s) | 28,401 | 1,650 | 1,940 | 1,920 | 3,945 | 3,403 | 3,196 | 3,166 | 3,696 | 2,815 | 2,669 |
Table 1 Interpretation: The facilities with scores in the lowest 30% (the first three deciles) represent less than 20% of the total patient-hours. This suggests that smaller facilities may tend to perform better. The mean performance is driven by very high scores in the top two deciles. If the average performance of Decile 3 (0) is considered a plausible, achievable score, and the entities in Deciles 4 through 10 improved to reach that score, the estimated rate per 1,000 hours of seclusion use could decrease, reducing preventable harm to patients that may result from excess seclusion.
Meaningfulness
Importance
The Meaningfulness criterion will be evaluated as part of the full Preliminary Assessment available in September.
Data Stream Burden Reduction
Data Stream Burden Reduction
This criterion will be evaluated as part of the full Preliminary Assessment available in September.
Alignment with the Patient Health Care Journey
Alignment with the Patient Health Care Journey
This criterion will be evaluated as part of the full Preliminary Assessment available in September.