
Breadcrumb

  1. Home

Long-Term Acute Care Facility

PRMR Measure Valid
On
Valid for Measure Submission

Catheter-Associated Urinary Tract Infection (CAUTI) Standardized Infection Ratio

CMS Measures Inventory Tool (CMIT) ID
00459-01-C-IRFQR
Steward Organization Group
Centers for Disease Control and Prevention
Committee
MSR Recommendation Group
    Measure Overview
      Use in CMS Programs
      CMS Program History
      • Finalized for inclusion in the Inpatient Rehabilitation Facility Quality Reporting program in 2012. 
      • Implemented in the Inpatient Rehabilitation Facility Quality Reporting program in 2014.
      • Also active in the Long-Term Care (LTC) Hospital Quality Reporting program and the PPS-Exempt Cancer Hospital Quality Reporting (PCHQR) Program. 
      Description

      Annual risk-adjusted standardized infection ratio (SIR) of catheter-associated urinary tract infections (CAUTI) among adults and children hospitalized as inpatients at acute care hospitals, critical access hospitals, oncology hospitals, long-term acute care hospitals, and acute care rehabilitation hospitals. SIR is reported annually and is calculated by dividing the number of observed CAUTIs by the number of predicted CAUTIs.   

      Numerator

      Number of annually observed catheter-associated urinary tract infections (CAUTI) in hospital inpatients.

      Numerator Exclusions

      N/A

      Numerator Exceptions

      N/A

      Denominator

      The denominator for both the SIR and the ARM is the total number of predicted CAUTI during hospitalization for patients within the unit of study (i.e., location under surveillance). The predicted number of infections for a facility is calculated based on the reported number of catheter days at the location-level using a negative binomial regression that accounts for the following risk factors:

      ACHs: CDC-defined location within a facility (e.g., critical ICUs, SCAs, step-down units, etc.), bed size, medical school affiliation, and facility type

      CAHs: medical school affiliation

      IRFs: setting type, proportion of admissions with traumatic and non-traumatic spinal cord dysfunction, proportion of admissions with stroke

      LTACHs: average length of stay, setting type, and location type.

      Denominator Exclusions

      The following are not considered indwelling catheters by NHSN definitions:

      • Suprapubic catheters
      • Condom catheters
      • “In and out” catheterizations
      • Nephrostomy tubes
      • Ileoconduits 
      Denominator Exceptions

      N/A

      Cascade of Meaningful Measures Priority
      Measure Type
      Outcome
      Level of Analysis
      Facility
      Care Setting
      Hospital: Inpatient Acute Care Facility
      PPS-Exempt Cancer Hospital
      Inpatient Rehabilitation Facility
      Long-Term Acute Care Facility
      CBE Endorsement Status
      Endorsed with Conditions
      CBE Endorsement History

      Endorsement History: 

      • Initial endorsement, 2012.
      • New measure endorsed with conditions Spring 2025.

      Link to Endorsement Measure Record: National Healthcare Safety Network (NHSN) Catheter-Associated Urinary Tract Infection (CAUTI) Outcome Measure

        About this Analysis (Measure Score by PY)

        Impact Summary: This measure supports the Inpatient Rehabilitation Facility Quality Reporting Program by assessing health care-associated catheter-associated urinary tract infections (CAUTI) among patients in bedded inpatient rehabilitation facilities, an outcome directly associated with patient safety and quality of care. 

        Based on the most recent data, the total estimated number of CAUTIs across all deciles is approximately 1,400. If inpatient rehabilitation facilities with higher CAUTI rates improved their performance to levels observed among better-performing facilities, the analysis suggests that up to about 1,400 CAUTIs could potentially be avoided, indicating a substantial opportunity for improved patient outcomes.

        For this measure, Battelle reviewed the following publicly available datasets available at Inpatient Rehabilitation Facility - Provider Data | Provider Data Catalog (cms.gov):

        • Inpatient_rehabilitation_facilities_03_2026.zip (which contains data from April 2024-March 2025 and is referred to as year 2024 in this assessment)
        • Inpatient_rehabilitation_facilities_03_2025.zip (which contains data from April 2023-March 2024 and is referred to as year 2023 in this assessment)
        • Inpatient_rehabilitation_facilities_03_2024.zip (which contains data from April 2022-March 2023 and is referred to as year 2022 in this assessment)
        • Inpatient_rehabilitation_facilities_03_2023.zip (which contains data from April 2021-March 2022 and is referred to as year 2021 in this assessment)

        Battelle analyzed all values for “I_006_01” not marked as “Not Available” from the corresponding Inpatient_Rehabilitation_Facility-Provider_Data.csv file.


        About Figure 1: Figure 1 is a boxplot that shows how scores have changed based on the most recent 4 years of data available. For each year, the boxplot displays a box with lines and dots to help visualize the range and distribution of scores. The dots represent the points where the lowest 5% and highest 5% of scores fall, and the line connecting them shows where 90% of the scores are located. The box itself covers the middle half of the scores, from the 25th to the 75th percentile. Inside the box, a horizontal line marks the median score, which is the middle value, while a “+” sign shows the average score. This type of graph makes overall trends in scores over time as well as the consistency and spread of the results easier to understand.
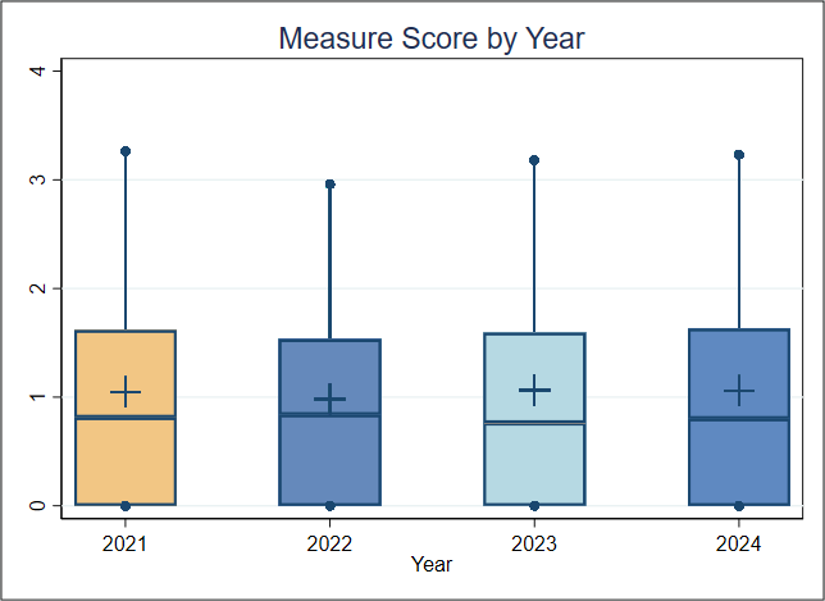
        Figure 1 (Measure Score by PY)
        boxplot


        Figure 1. Boxplot of Measure Score by Year

        Interpretation (Measure Score by PY)

        Figure 1 Interpretation: There is no discernible change across the 4 years. For this measure, a lower score indicates better quality of care.

        About this Analysis (Score Distro)

        About Table 1: Table 1 illustrates the distribution of scores and the number of patients represented within each group. It is important to note that the groups (referred to as deciles, each comprising 10% of the organizations) with the lowest or highest scores may contain more or fewer patients than other groups. For example, if the lowest-scoring decile includes only 5% of the total patient population, this smaller group size may be associated with lower performance scores.

        Table 1 (Score Distro)

        Table 1. Importance in the Most Recent Year of Data Available (Decile by Measure Score, FY2024) 

         OverallDecile 1Decile 2Decile 3Decile 4Decile 5Decile 6Decile 7Decile 8Decile 9Decile 10
        Average SIR (Standard Deviation)

        1.060 (1.089)

        0

        0

        0

        0

        0.117

        0.688

        1.142

        1.706

        2.326

        3.562

        Average Raw Rate (Standard Deviation)

        0.200 (0.328)

        0

        0

        0

        0

        0.006

        0.099

        0.194

        0.291

        0.450

        0.957

        Entities

        1,123

        113

        112

        112

        113

        112

        112

        113

        112

        112

        112

        Patients

        790,630

        50,594

        48,918

        58,134

        49,690

        77,282

        167,930

        116,230

        100,352

        82,073

        39,427

        Interpretation (Score Distro)

        Table 1 Interpretation: To estimate the number of negative outcomes (CAUTIs), the number of patients is multiplied by the average raw rate for each decile. Right now, the total estimated number of negative outcomes across all deciles is about 1,400. If the average performance of Decile 3 (0%) is considered a plausible, achievable score, and the entities in Deciles 4 through 10 improved to reach that score, about 1,400 fewer measured patients would contract CAUTIs. This translates to about one patient per entity.

          Importance Criterion Definition

          The Meaningfulness criterion will be evaluated as part of the full Preliminary Assessment available in September. 

            Criterion Definition

            This criterion will be evaluated as part of the full Preliminary Assessment available in September. 
              Criterion Definition

              This criterion will be evaluated as part of the full Preliminary Assessment available in September. 
              PA Type
              Performance and Impact Analysis (PIA)

              Catheter-Associated Urinary Tract Infection (CAUTI) Standardized Infection Ratio

              CMS Measures Inventory Tool (CMIT) ID
              00459-01-C-LTCHQR
              Steward Organization Group
              Centers for Disease Control and Prevention
              Committee
              MSR Recommendation Group
                Measure Overview
                  Use in CMS Programs
                  CMS Program History
                  • Finalized for inclusion in the Long-Term Care Hospital Quality Reporting Program in 2011. 
                  • Implemented in the Long-Term Care Hospital Quality Reporting Program in 2013.
                  • Also active in the Inpatient Rehabilitation Facility Quality Reporting Program and the PPS-Exempt Cancer Hospital Quality Reporting (PCHQR) Program.
                  Description

                  Annual risk-adjusted standardized infection ratio (SIR) of catheter-associated urinary tract infections (CAUTI) among adults and children hospitalized as inpatients at acute care hospitals, critical access hospitals, oncology hospitals, long-term acute care hospitals, and acute care rehabilitation hospitals. SIR is reported annually and is calculated by dividing the number of observed CAUTIs by the number of predicted CAUTIs.

                  Numerator

                  Number of annually observed catheter-associated urinary tract infections (CAUTI) in hospital inpatients. 

                  Numerator Exclusions

                  N/A

                  Numerator Exceptions

                  N/A

                  Denominator

                  Number of annually predicted catheter-associated urinary tract infections (CAUTI) in hospital inpatients.  

                  Denominator Exclusions

                  The following are not considered indwelling catheters by NHSN definitions:

                  • Suprapubic catheters
                  • Condom catheters
                  • “In and out” catheterizations
                  • Nephrostomy tubes
                  • Ileoconduits 
                  Denominator Exceptions

                  N/A

                  Cascade of Meaningful Measures Priority
                  Measure Type
                  Outcome
                  Level of Analysis
                  Facility
                  Care Setting
                  Hospital: Inpatient Acute Care Facility
                  PPS-Exempt Cancer Hospital
                  Hospital: Outpatient
                  Inpatient Rehabilitation Facility
                  Long-Term Acute Care Facility
                  CBE Endorsement Status
                  Endorsed with Conditions
                  CBE Endorsement History

                  Endorsement History: 

                  • Initial endorsement, 2012.
                  • New measure endorsed with conditions Spring 2025.

                  Link to Endorsement Measure Record: National Healthcare Safety Network (NHSN) Catheter-Associated Urinary Tract Infection (CAUTI) Outcome Measure

                    About this Analysis (Measure Score by PY)

                    Impact Summary: This measure supports the Long-Term Care Hospital Quality Reporting Program by assessing health care-associated catheter-associated urinary tract infections (CAUTI) among patients in bedded long-term care hospitals, an outcome directly associated with patient safety and quality of care. 

                    There was no discernible change in performance among entities reporting on this measure during the years examined. Based on the most recent data, the total estimated number of CAUTIs across all deciles is approximately 1,400. If long-term care hospitals with higher CAUTI rates improved their performance to levels observed among better-performing facilities, the analysis suggests that up to about 1,000 CAUTIs could potentially be avoided, representing a meaningful opportunity for improved patient outcomes.

                    For this measure, Battelle reviewed the following publicly available datasets available at Long-Term Care Hospital - Provider Data | Provider Data Catalog (cms.gov)

                    • long-term_care_hospitals_03_2026.zip (which contains data from April 2024-March 2025 and is referred to as year 2024 in this assessment)
                    • long-term_care_hospitals_03_2025.zip (which contains data from April 2023-March 2024 and is referred to as year 2023 in this assessment)
                    • long-term_care_hospitals_03_2024.zip (which contains data from April 2022-March 2023 and is referred to as year 2022 in this assessment)
                    • long-term_care_hospitals_03_2023.zip (which contains data from April 2021-March 2022 and is referred to as year 2021 in this assessment)

                    Battelle analyzed all values for “L_006_01” not marked as “Not Available” from the corresponding Long-term_Care_Hospital-Provider_Data.csv file.


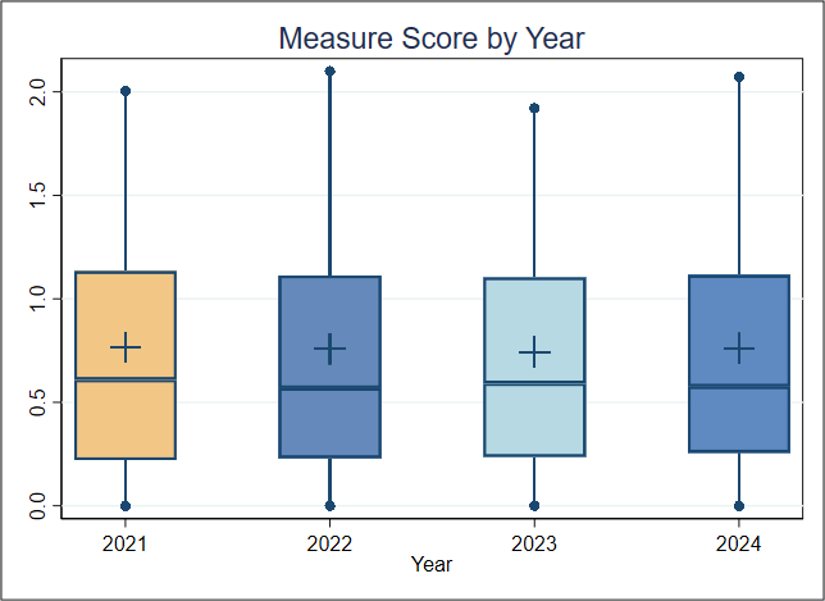
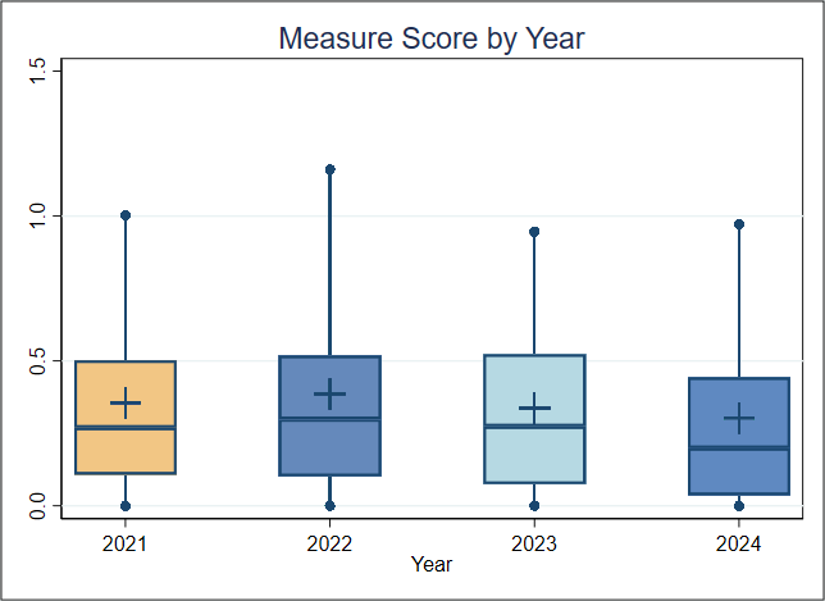
                    About Figure 1: Figure 1 is a boxplot that shows how scores have changed based on the most recent 4 years of data available. For each year, the boxplot displays a box with lines and dots to help visualize the range and distribution of scores. The dots represent the points where the lowest 5% and highest 5% of scores fall, and the line connecting them shows where 90% of the scores are located. The box itself covers the middle half of the scores, from the 25th to the 75th percentile. Inside the box, a horizontal line marks the median score, which is the middle value, while a “+” sign shows the average score. This type of graph makes overall trends in scores over time as well as the consistency and spread of the results easier to understand.

                    Figure 1 (Measure Score by PY)
                    boxplot


                    Figure 1. Boxplot of Measure Score by Year

                    Interpretation (Measure Score by PY)

                    Figure 1 Interpretation: There is no discernible change across the 4 years; the median score had a range between a minimum of 0.57 to a maximum of 0.61. For this measure, a lower score indicates better quality of care.

                    About this Analysis (Score Distro)

                    About Table 1: Table 1 illustrates the distribution of scores (standardized infection ratios [SIRs]), raw rates, and the number of patients represented within each group. It is important to note that the groups (referred to as deciles, each comprising 10% of the organizations) with the lowest or highest scores may contain more or fewer patients than other groups. For example, if the lowest-scoring decile includes only 5% of the total patient population, this smaller group size may be associated with lower performance scores.

                    For this measure, Decile 1 represents a group of 32 hospitals with the highest measure scores and Decile 10 shows those with the lowest measure scores. 

                    Table 1 (Score Distro)

                    Table 1. Importance in the Most Recent Year of Data Available (Decile by Measure Score, FY2024) 

                     OverallDecile 1Decile 2Decile 3Decile 4Decile 5Decile 6Decile 7Decile 8Decile 9Decile 10
                    Average SIR (Standard Deviation)

                    0.760 (0.730)

                    0

                    0

                    0.233

                    0.425

                    0.515

                    0.651

                    0.902

                    1.19

                    1.409

                    2.217

                    Average Raw Rate (Standard Deviation)

                    0.130 (0.122)

                    0

                    0

                    0.037

                    0.067

                    0.089

                    0.111

                    0.147

                    0.192

                    0.241

                    0.394

                    Entities

                    312

                    32

                    31

                    31

                    31

                    31

                    32

                    31

                    31

                    31

                    31

                    Patients

                    1,058,542

                    76,535

                    74,451

                    125,653

                    106,053

                    125,180

                    115,518

                    110,660

                    101,551

                    107,002

                    115,939

                    Interpretation (Score Distro)

                    Table 1 Interpretation: To estimate the number of negative outcomes (CAUTIs), the number of patients is multiplied by the average raw rate for each decile. In 2024, the total estimated number of negative outcomes across all deciles is about 1,400. If the average performance of Decile 3 (0.037%) is considered a plausible, achievable score, and the entities in Deciles 4 through 10 improved to reach that score, about 1,000 fewer negative outcomes could occur. This translates to about three patients per entity and means that improving performance on this measure could help ensure that several hundred fewer patients contract CAUTIs, potentially leading to better health outcomes.

                      Importance Criterion Definition

                      The Meaningfulness criterion will be evaluated as part of the full Preliminary Assessment available in September. 

                        Criterion Definition

                        This criterion will be evaluated as part of the full Preliminary Assessment available in September. 
                          Criterion Definition

                          This criterion will be evaluated as part of the full Preliminary Assessment available in September. 
                          PA Type
                          Performance and Impact Analysis (PIA)

                          Catheter-Associated Urinary Tract Infection (CAUTI) Standardized Infection Ratio

                          CMS Measures Inventory Tool (CMIT) ID
                          00459-01-C-PCHQR
                          Steward Organization Group
                          Centers for Disease Control and Prevention
                          Committee
                          MSR Recommendation Group
                            Measure Overview
                              Use in CMS Programs
                              CMS Program History
                              • Finalized for inclusion in the PPS-Exempt Cancer Hospital Quality Reporting (PCHQR) Program in 2012. 
                              • Implemented in the PCHQR Program in 2013.
                              • Also active in the Inpatient Rehabilitation Facility Quality Reporting Program and the Long-Term Care Hospital Quality Reporting Program.
                              Description

                              Annual risk-adjusted standardized infection ratio (SIR) of catheter-associated urinary tract infections (CAUTI) among adults and children hospitalized as inpatients at acute care hospitals, critical access hospitals, oncology hospitals, long-term acute care hospitals, and acute care rehabilitation hospitals. SIR is reported annually and is calculated by dividing the number of observed CAUTIs by the number of predicted CAUTIs.   

                              Numerator

                              Number of annually observed catheter-associated urinary tract infections (CAUTI) in hospital inpatients.   

                              Numerator Exclusions

                              N/A

                              Numerator Exceptions

                              N/A

                              Denominator

                              Number of annually predicted catheter-associated urinary tract infections (CAUTI) in hospital inpatients.  

                              Denominator Exclusions

                              The following are not considered indwelling catheters by NHSN definitions:

                              • Suprapubic catheters
                              • Condom catheters
                              • “In and out” catheterizations
                              • Nephrostomy tubes
                              • Ileoconduits 
                              Denominator Exceptions

                              N/A

                              Cascade of Meaningful Measures Priority
                              Measure Type
                              Outcome
                              Level of Analysis
                              Facility
                              Care Setting
                              Hospital: Inpatient Acute Care Facility
                              PPS-Exempt Cancer Hospital
                              Inpatient Rehabilitation Facility
                              Long-Term Acute Care Facility
                              CBE Endorsement Status
                              Endorsed with Conditions
                              CBE Endorsement History

                              Endorsement History: 

                              • Initial endorsement, 2012.
                              • New measure endorsed with conditions Spring 2025. 

                              Link to Endorsement Measure Record: National Healthcare Safety Network (NHSN) Catheter-Associated Urinary Tract Infection (CAUTI) Outcome Measure

                                About this Analysis (Measure Score by PY)

                                Impact Summary: This measure aligns with Prospective Payment System-Exempt Cancer Hospital Quality Reporting (PCHQR) Program goals by delivering outcome-based, facility-level data to inform consumer choice and promote accountability. It encourages hospitals and clinicians to improve inpatient care for Medicare beneficiaries by tracking and reporting best practices across varied care settings. 

                                Performance change over time was difficult to assess as only 11 entities reported on this measure during the years assessed. Drawing from Table 1, if all hospitals improved their infection rates to match the average score found in Decile 3, there could be about 50 fewer CAUTI infections overall. On average, each hospital would see four fewer patients affected. Improving performance to achieve this average could help more patients avoid infections and lead to better health outcomes.

                                For this measure, Battelle reviewed the following publicly available datasets available at Hospitals data archive | Provider Data Catalog:

                                • Hospitals_02_2026.zip (which contains data from April 2024-March 2025 and is referred to as year 2024 in this assessment)
                                • Hospitals_02_2025.zip (which contains data from April 2023-March 2024 and is referred to as year 2023 in this assessment)
                                • Hospitals_01_2024.zip (which contains data from April 2022-March 2023 and is referred to as year 2022 in this assessment)
                                • Hospitals_01_2023.zip (which contains data from April 2021-March 2022 and is referred to as year 2021 in this assessment)

                                Battelle analyzed all values for “PCH_5” not marked as “Not Available” from the corresponding PCH_HEALTHCARE_ASSOCIATED_INFECTIONS_HOSPITAL.csv file.


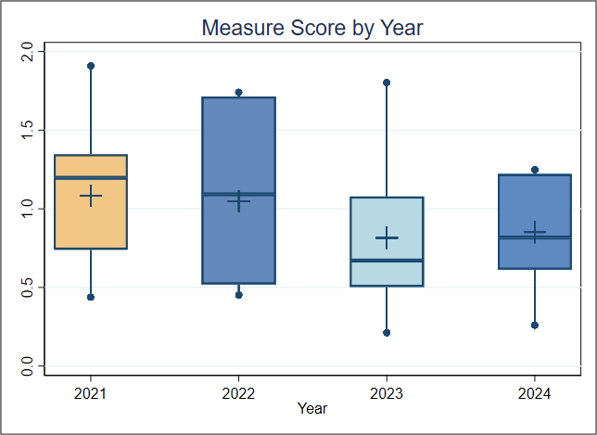
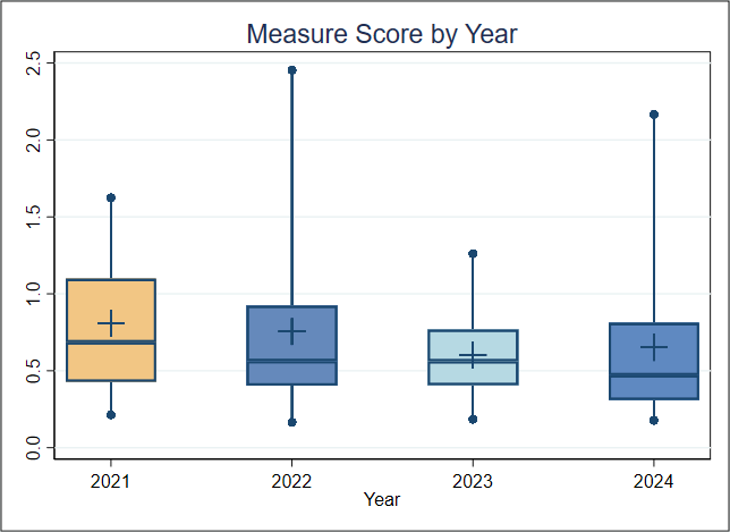
                                About Figure 1: Figure 1 is a boxplot that shows how scores have changed based on the most recent 4 years of data available. For each year, the boxplot displays a box with lines and dots to help visualize the range and distribution of scores. The dots represent the points where the lowest 5% and highest 5% of scores fall, and the line connecting them shows where 90% of the scores are located. The box itself covers the middle half of the scores, from the 25th to the 75th percentile. Inside the box, a horizontal line marks the median score, which is the middle value, while a “+” sign shows the average score. This type of graph makes overall trends in scores over time as well as the consistency and spread of the results easier to understand.

                                Figure 1 (Measure Score by PY)
                                boxplot


                                Figure 1. Boxplot of Measure Score by Year

                                Interpretation (Measure Score by PY)

                                Figure 1 Interpretation: There are only 11 entities per year, so any apparent trend may just as likely be attributed to random error, indicating little discernible change across the 4 years. For this measure, a lower score indicates better quality of care.

                                About this Analysis (Score Distro)

                                About Table 1: Table 1 illustrates the distribution of scores (standardized infection ratio [SIR]), raw rates, and the number of patients represented within each group. It is important to note that the groups (referred to as deciles, each comprising 10% of the organizations) with the lowest or highest scores may contain more or fewer patients than other groups. For example, if the lowest-scoring decile includes only 5% of the total patient population, then smaller entity size may be associated with lower performance scores.

                                Table 1 (Score Distro)

                                Table 1. Importance in the Most Recent Year of Data Available (Decile by Measure Score, FY2024) 

                                 OverallDecile 1Decile 2Decile 3Decile 4Decile 5Decile 6Decile 7Decile 8Decile 9Decile 10
                                Average SIR (Standard Deviation)

                                0.851 (0.361)

                                N/A

                                0.260

                                0.574

                                0.729

                                0.654

                                0.906

                                1.223

                                1.216

                                1.248

                                N/A

                                Average Raw Rate (Standard Deviation)

                                0.102 (0.114)

                                0

                                0.032

                                0.050

                                0.066

                                0.072

                                0.081

                                0.122

                                0.138

                                0.147

                                0.410

                                Entities

                                11

                                2

                                1

                                1

                                1

                                1

                                1

                                1

                                1

                                1

                                1

                                Patients

                                119,667

                                974

                                21,860

                                2,017

                                31,633

                                12,421

                                12,326

                                4,911

                                11,564

                                21,717

                                244


                                Interpretation (Score Distro)

                                Table 1 Interpretation: Note that there are data for only 11 entities, and that the SIR is not available (N/A) for three of them due to an expected value less than 1. To estimate the number of negative outcomes (CAUTI infections), the number of patients is multiplied by the average raw rate for each decile. Right now, the total estimated number of negative outcomes across all deciles is about 100. If the average performance of Decile 3 (0.574%) is considered a plausible, achievable rate, and the entities in Deciles 4 through 10 improved to reach that rate, about 50 fewer negative outcomes could occur. This translates to about four patients per entity and means that improving performance on this measure could help ensure that fewer patients contract CAUTI infections, potentially leading to better health outcomes.

                                  Importance Criterion Definition

                                  The Meaningfulness criterion will be evaluated as part of the full Preliminary Assessment available in September. 
                                    Criterion Definition

                                    This criterion will be evaluated as part of the full Preliminary Assessment available in September. 

                                      Criterion Definition

                                      This criterion will be evaluated as part of the full Preliminary Assessment available in September. 

                                      PA Type
                                      Performance and Impact Analysis (PIA)

                                      Catheter-Associated Urinary Tract Infection (CAUTI) Standardized Infection Ratio

                                      Annual risk-adjusted standardized infection ratio (SIR) of catheter-associated urinary tract infections (CAUTI) among adults and children hospitalized as inpatients at acute care hospitals, oncology hospitals, long-term acute care hospitals, and acute care rehabilitation hospitals.   SIR is reported annually and is calculated by dividing the number of observed CAUTIs into the number of predicted CAUTIs. 


                                      CBE ID
                                      0138

                                      Central Line-Associated Bloodstream Infection (CLABSI) Standardized Infection Ratio

                                      Annual risk-adjusted standardized infection ratio (SIR) of central line-associated bloodstream infections (CLABSI) among adults and children hospitalized as inpatients at acute care hospitals, critical access hospitals, oncology hospitals, and long-term acute care hospitals. SIR is reported annually and is calculated by dividing the number of observed CLABSIs by the number of predicted CLABSIs.   


                                      CBE ID
                                      0139

                                      Clostridioides difficile (CDI) LabID Event Standardized Infection Ratio

                                      CMS Measures Inventory Tool (CMIT) ID
                                      00462-01-C-IRFQR
                                      Steward Organization Group
                                      Centers for Disease Control and Prevention
                                      Committee
                                      MSR Recommendation Group
                                        Measure Overview
                                          Use in CMS Programs
                                          CMS Program History
                                          • Finalized for inclusion in the Inpatient Rehabilitation Facility Quality Reporting Program in 2014. 
                                          • Implemented in the Inpatient Rehabilitation Facility Quality Reporting Program in 2016.
                                          • Also active in the Long-Term Care Hospital Quality Reporting Program and the PPS-Exempt Cancer Hospital Quality Reporting (PCHQR) Program.
                                          Description

                                          Annual risk-adjusted standardized infection ratio (SIR) of Clostridioides difficile (CDI) LabID events among adults and pediatrics hospitalized as inpatients at acute care hospitals, oncology hospitals, long-term acute care hospitals, and acute care rehabilitation hospitals. SIR is reported annually and is calculated by dividing the number of observed CDIs into the number of predicted CDIs

                                          Numerator

                                          Number of annually observed Clostridioides difficile (CDI) LabID events in hospital inpatients. 

                                          Numerator Exclusions

                                          N/A

                                          Numerator Exceptions

                                          N/A

                                          Denominator

                                          Number of annually predicted Clostridioides difficile (CDI) LabID events in hospital inpatients.    

                                          Denominator Exclusions

                                          Baby based locations such as, neonatal ICU, special care nursery and well-baby nurseries, are excluded from the denominator count. In LDRP locations, moms and babies must each be counted separately (as two patients). Any locations that predominantly house infants, including NICU, SCN, or well-baby locations (for example, nurseries, babies in LDRP) are excluded. 

                                          Denominator Exceptions

                                          N/A

                                          Cascade of Meaningful Measures Priority
                                          Measure Type
                                          Outcome
                                          Level of Analysis
                                          Facility
                                          Care Setting
                                          Hospital: Inpatient Acute Care Facility
                                          Hospital: Critical Access
                                          Inpatient Rehabilitation Facility
                                          Long-Term Acute Care Facility
                                          CBE Endorsement Status
                                          Endorsed
                                          CBE Endorsement History

                                          Endorsement History: The measure was last endorsed in 2025 and is up for re-endorsement in 2029 

                                          Link to Endorsement Measure Record: Clostridioides difficile (CDI) LabID Event Standardized Infection Ratio | Partnership for Quality Measurement

                                            About this Analysis (Measure Score by PY)

                                            Impact Summary: This measure supports the Inpatient Rehabilitation Facility Quality Reporting Program by assessing facility-wide hospital-onset Clostridioides difficile infections (CDIs) among patients in inpatient rehabilitation facilities, an outcome closely tied to patient safety and infection prevention. 

                                            Based on the most recent data, the total estimated number of CDIs across all deciles is approximately 1,500. If inpatient rehabilitation facilities with higher CDI rates improved their performance to levels observed among better-performing facilities, this would result in about one less CDI per facility, indicating limited opportunity to improve patient outcomes.

                                            For this measure, Battelle reviewed the following publicly available datasets available at Inpatient Rehabilitation Facility - Provider Data | Provider Data Catalog (cms.gov):

                                            • Inpatient_rehabilitation_facilities_03_2026.zip (which contains data from April 2024-March 2025 and is referred to as year 2024 in this assessment)
                                            • Inpatient_rehabilitation_facilities_03_2025.zip (which contains data from April 2023-March 2024 and is referred to as year 2023 in this assessment)
                                            • Inpatient_rehabilitation_facilities_03_2024.zip (which contains data from April 2022-March 2023 and is referred to as year 2022 in this assessment)
                                            • Inpatient_rehabilitation_facilities_03_2023.zip (which contains data from April 2021-March 2022 and is referred to as year 2021 in this assessment)

                                            Battelle analyzed all values for “I_015_01” not marked as “Not Available” from the corresponding Inpatient_Rehabilitation_Facility-Provider_Data.csv file.


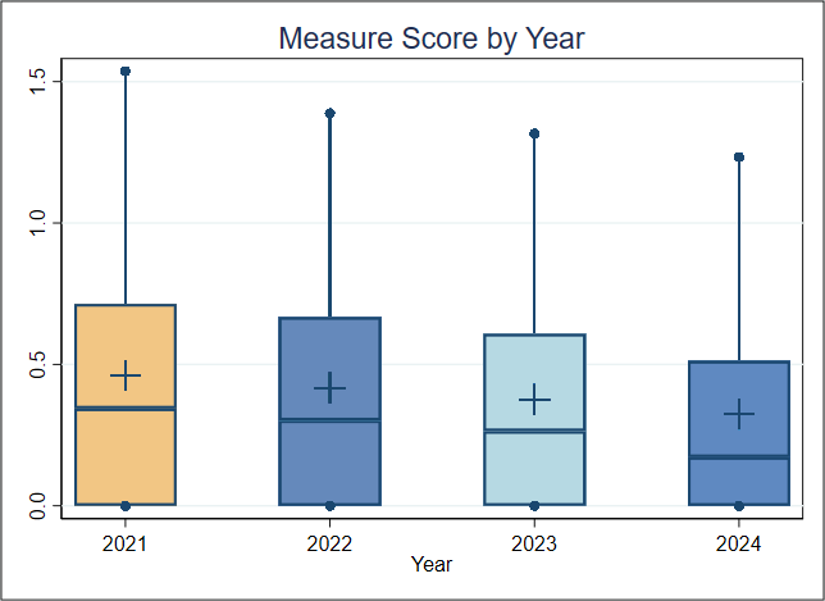
                                            About Figure 1: Figure 1 is a boxplot that shows how scores have changed based on the most recent 4 years of data available. For each year, the boxplot displays a box with lines and dots to help visualize the range and distribution of scores. The dots represent the points where the lowest 5% and highest 5% of scores fall, and the line connecting them shows where 90% of the scores are located. The box itself covers the middle half of the scores, from the 25th to the 75th percentile. Inside the box, a horizontal line marks the median score, which is the middle value, while a “+” sign shows the average score. This type of graph makes overall trends in scores over time as well as the consistency and spread of the results easier to understand.

                                            Figure 1 (Measure Score by PY)

                                            Figure 1. Boxplot of Measure Score by Year

                                            Interpretation (Measure Score by PY)

                                            Figure 1 Interpretation: Figure 1 shows a decreasing trend from a median standardized infection ratio (SIR) of 0.34 in 2022 to a median SIR of 0.17 in 2024. For this measure, a lower score indicates better quality of care.

                                            About this Analysis (Score Distro)

                                            About Table 1: Table 1 illustrates the distribution of scores (SIRs), raw rates, and the number of patients represented within each group. It is important to note that the groups (referred to as deciles, each comprising 10% of the organizations) with the lowest or highest scores may contain more or fewer patients than other groups. For example, if the lowest-scoring decile includes only 5% of the total patient population, this smaller group size may be associated with lower performance scores.

                                            Table 1 (Score Distro)

                                            Table 1. Importance in the Most Recent Year of Data Available (Decile by Measure Score, FY2024) 

                                             OverallDecile 1Decile 2Decile 3Decile 4Decile 5Decile 6Decile 7Decile 8Decile 9Decile 10
                                            Average SIR (Standard Deviation)

                                            0.320 (0.440)

                                            0

                                            0

                                            0

                                            0

                                            0.002

                                            0.178

                                            0.326

                                            0.490

                                            0.743

                                            1.330

                                            Average Raw Rate (Standard Deviation)

                                            0.013 (0.020)

                                            0

                                            0

                                            0

                                            0

                                            0

                                            0.007

                                            0.013

                                            0.020

                                            0.030

                                            0.060

                                            Entities

                                            1,122

                                            113

                                            112

                                            112

                                            112

                                            112

                                            113

                                            112

                                            112

                                            112

                                            112

                                            Patients

                                            10,840,927

                                            793,952

                                            722,084

                                            664,810

                                            688,265

                                            716,002

                                            2,010,023

                                            1,862,498

                                            1,374,188

                                            1,203,579

                                            805,526

                                            Interpretation (Score Distro)

                                            Table 1 Interpretation: To estimate the number of negative outcomes (CDIs), the number of patients is multiplied by the average raw rate for each decile. Right now, the total estimated number of negative outcomes across all deciles is about 1,500. If the average performance of Decile 3 (0%) is considered a plausible, achievable score, and the entities in Deciles 4 through 10 improved to reach that score, the estimated number of eligible patients with CDIs would go down by about 1,500. This translates to about one patient per entity.

                                              Importance Criterion Definition

                                              The Meaningfulness criterion will be evaluated as part of the full Preliminary Assessment available in September. 

                                                Criterion Definition

                                                This criterion will be evaluated as part of the full Preliminary Assessment available in September. 

                                                  Criterion Definition

                                                  This criterion will be evaluated as part of the full Preliminary Assessment available in September. 

                                                  PA Type
                                                  Performance and Impact Analysis (PIA)

                                                  Clostridioides difficile (CDI) LabID Event Standardized Infection Ratio

                                                  CMS Measures Inventory Tool (CMIT) ID
                                                  00462-01-C-LTCHQR
                                                  Steward Organization Group
                                                  Centers for Disease Control and Prevention
                                                  Committee
                                                  MSR Recommendation Group
                                                    Measure Overview
                                                      Use in CMS Programs
                                                      CMS Program History
                                                      • Finalized for inclusion in the Long-Term Care Hospital Quality Reporting Program in 2013. 
                                                      • Implemented in the Long-Term Care Hospital Quality Reporting Program in 2016.
                                                      • Also active in the Inpatient Rehabilitation Facility Quality Reporting Program and the PPS-Exempt Cancer Hospital Quality Reporting (PCHQR) Program.
                                                      Description

                                                      Annual risk-adjusted standardized infection ratio (SIR) of Clostridioides difficile (CDI) LabID events among adults and pediatrics hospitalized as inpatients at acute care hospitals, oncology hospitals, long-term acute care hospitals, and acute care rehabilitation hospitals.  SIR is reported annually and is calculated by dividing the number of observed CDIs into the number of predicted CDIs.  

                                                      Numerator

                                                      Number of annually observed Clostridioides difficile (CDI) LabID events in hospital inpatients. 

                                                      Numerator Exclusions

                                                      N/A

                                                      Numerator Exceptions

                                                      N/A

                                                      Denominator

                                                      Number of annually predicted Clostridioides difficile (CDI) LabID events in hospital inpatients.    

                                                      Denominator Exclusions

                                                      Baby based locations such as neonatal ICU, special care nursery and well-baby nurseries, are excluded from the denominator count. In LDRP locations, moms and babies must each be counted separately (as two patients). Any locations that predominantly house infants, including NICU, SCN, or well-baby locations (for example, nurseries, babies in LDRP) are excluded. 

                                                      Denominator Exceptions

                                                      N/A

                                                      Cascade of Meaningful Measures Priority
                                                      Measure Type
                                                      Outcome
                                                      Level of Analysis
                                                      Facility
                                                      Care Setting
                                                      Long-Term Acute Care Facility
                                                      CBE Endorsement Status
                                                      Endorsed
                                                      CBE Endorsement History

                                                      Endorsement History: The measure was last endorsed in 2025 and is up for re-endorsement in 2029 

                                                      Link to Endorsement Measure Record: Clostridioides difficile (CDI) LabID Event Standardized Infection Ratio | Partnership for Quality Measurement

                                                        About this Analysis (Measure Score by PY)

                                                        Impact Summary: This measure supports the Long-Term Care Hospital Quality Reporting Program by assessing facility-wide hospital-onset Clostridioides difficile infections (CDIs) among patients in long-term care hospitals, an outcome closely associated with patient safety and infection prevention. 

                                                        Based on the most recent data, the total estimated number of CDIs across all deciles is approximately 1,000. If long-term care hospitals with higher CDI rates improved their performance to levels observed among better-performing facilities, the analysis suggests that several hundred CDIs could potentially be avoided, indicating a meaningful opportunity for improved patient outcomes.

                                                        For this measure, Battelle reviewed the following publicly available datasets available at Long-Term Care Hospital - Provider Data | Provider Data Catalog (cms.gov):

                                                        • long-term_care_hospitals_03_2026.zip (which contains data from April 2024-March 2025 and is referred to as year 2024 in this assessment)
                                                        • long-term_care_hospitals_03_2025.zip (which contains data from April 2023-March 2024 and is referred to as year 2023 in this assessment)
                                                        • long-term_care_hospitals_03_2024.zip (which contains data from April 2022-March 2023 and is referred to as year 2022 in this assessment)
                                                        • long-term_care_hospitals_03_2023.zip (which contains data from April 2021-March 2022 and is referred to as year 2021 in this assessment)

                                                        Battelle analyzed all values for “L_014_01” not marked as “Not Available” from the corresponding Long-term_Care_Hospital-Provider_Data.csv file.


                                                        About Figure 1: Figure 1 is a boxplot that shows how scores have changed based on the most recent 4 years of data available. For each year, the boxplot displays a box with lines and dots to help visualize the range and distribution of scores. The dots represent the points where the lowest 5% and highest 5% of scores fall, and the line connecting them shows where 90% of the scores are located. The box itself covers the middle half of the scores, from the 25th to the 75th percentile. Inside the box, a horizontal line marks the median score, which is the middle value, while a “+” sign shows the average score. This type of graph makes overall trends in scores over time as well as the consistency and spread of the results easier to understand.

                                                        Figure 1 (Measure Score by PY)
                                                        boxplot


                                                        Figure 1. Boxplot of Measure Score by Year

                                                        Interpretation (Measure Score by PY)

                                                        Figure 1 Interpretation: Although there was no discernible change from 2021 to 2022, Figure 1 shows a decreasing trend from a median standardized infection ratio (SIR) of 0.3 in 2022 to a median SIR of 0.2 in 2024. For this measure, a lower score indicates better quality of care.

                                                        About this Analysis (Score Distro)

                                                        About Table 1: Table 1 illustrates the distribution of scores (SIRs), raw rates, and the number of patients represented within each group. It is important to note that the groups (referred to as deciles, each comprising 10% of the organizations) with the lowest or highest scores may contain more or fewer patients than other groups. For example, if the lowest-scoring decile includes only 5% of the total patient population, then smaller group size may be associated with lower performance scores.

                                                        Table 1 (Score Distro)

                                                        Table 1. Importance (Decile by Measure Score, FY2024) 

                                                         OverallDecile 1Decile 2Decile 3Decile 4Decile 5Decile 6Decile 7Decile 8Decile 9Decile 10
                                                        Average SIR (Standard Deviation)

                                                        0.300 (0.335)

                                                        0

                                                        0

                                                        0.036

                                                        0.110

                                                        0.173

                                                        0.241

                                                        0.317

                                                        0.461

                                                        0.655

                                                        1.049

                                                        Average Raw Rate (Standard Deviation)

                                                        0.030 (0.030)

                                                        0

                                                        0

                                                        0.003

                                                        0.011

                                                        0.016

                                                        0.021

                                                        0.029

                                                        0.042

                                                        0.059

                                                        0.095

                                                        Entities

                                                        312

                                                        32

                                                        31

                                                        31

                                                        31

                                                        31

                                                        32

                                                        31

                                                        31

                                                        31

                                                        31

                                                        Patients

                                                        4,207,696

                                                        304,536

                                                        206,866

                                                        852,566

                                                        449,200

                                                        482,814

                                                        466,775

                                                        363,369

                                                        434,037

                                                        325,420

                                                        322,113

                                                        Interpretation (Score Distro)

                                                        Table 1 Interpretation: To estimate the number of negative outcomes (CDIs), the number of patients is multiplied by the average raw rate for each decile. Right now, the total estimated number of negative outcomes across all deciles is about 1,000. If the average performance of Decile 3 (0.003%) is considered a plausible, achievable score, and the entities in Deciles 4 through 10 improved to reach that score, about 900 fewer negative outcomes could occur. This translates to about three patients per entity and means that improving performance on this measure could help ensure that several hundred fewer patients contract CDIs, potentially leading to better health outcomes.

                                                          Importance Criterion Definition

                                                          The Meaningfulness criterion will be evaluated as part of the full Preliminary Assessment available in September. 

                                                            Criterion Definition

                                                            This criterion will be evaluated as part of the full Preliminary Assessment available in September. 

                                                              Criterion Definition

                                                              This criterion will be evaluated as part of the full Preliminary Assessment available in September. 

                                                              PA Type
                                                              Performance and Impact Analysis (PIA)

                                                              Clostridioides difficile (CDI) LabID Event Standardized Infection Ratio

                                                              CMS Measures Inventory Tool (CMIT) ID
                                                              00462-01-C-PCHQR
                                                              Steward Organization Group
                                                              Centers for Disease Control and Prevention
                                                              Committee
                                                              MSR Recommendation Group
                                                                Measure Overview
                                                                  Use in CMS Programs
                                                                  CMS Program History
                                                                  • Finalized for inclusion in the Prospective Payment System-Exempt Cancer Hospital Quality Reporting Program in 2015. 
                                                                  • Implemented in the Prospective Payment System-Exempt Cancer Hospital Quality Reporting Program in 2017.
                                                                  • Also active in the Long-Term Care Hospital Quality Reporting Program and the Inpatient Rehabilitation Facility Quality Reporting Program.
                                                                  Description

                                                                  Annual risk-adjusted standardized infection ratio (SIR) of Clostridioides difficile (CDI) LabID events among adults and pediatrics hospitalized as inpatients at acute care hospitals, oncology hospitals, long-term acute care hospitals, and acute care rehabilitation hospitals.  SIR is reported annually and is calculated by dividing the number of observed CDIs into the number of predicted CDIs.  

                                                                  Numerator

                                                                  Number of annually observed Clostridioides difficile (CDI) LabID events in hospital inpatients. 

                                                                  Numerator Exclusions

                                                                  N/A

                                                                  Numerator Exceptions

                                                                  N/A

                                                                  Denominator

                                                                  Number of annually predicted Clostridioides difficile (CDI) LabID events in hospital inpatients.    

                                                                  Denominator Exclusions

                                                                  Baby based locations such as, neonatal ICU, special care nursery and well-baby nurseries, are excluded from the denominator count. In LDRP locations, moms and babies must each be counted separately (as two patients). Any locations that predominantly house infants, including NICU, SCN, or well-baby locations (for example, nurseries, babies in LDRP) are excluded. 

                                                                  Denominator Exceptions

                                                                  N/A

                                                                  Cascade of Meaningful Measures Priority
                                                                  Measure Type
                                                                  Outcome
                                                                  Level of Analysis
                                                                  Other
                                                                  Care Setting
                                                                  Hospital: Inpatient Acute Care Facility
                                                                  PPS-Exempt Cancer Hospital
                                                                  Inpatient Rehabilitation Facility
                                                                  Long-Term Acute Care Facility
                                                                  CBE Endorsement Status
                                                                  Endorsed with Conditions
                                                                  CBE Endorsement History

                                                                  Endorsement History: Endorsed with conditions, 2025 

                                                                  Conditions for maintenance review in 3 years, the developer will have: Explored the possibility of using other all-payer data sources to expand the use of patient-level factors in the risk adjustment model and reduce reliance on facility-level factors.

                                                                  Link to Endorsement Measure Record: Clostridioides difficile (CDI) LabID Event Standardized Infection Ratio

                                                                    About this Analysis (Measure Score by PY)

                                                                    Impact Summary: By assessing the difference between observed and expected hospital-onset CDI LabID events among inpatients—accounting for facility characteristics such as bed size, academic affiliation, diagnostic method, and patient prevalence—this measure supports PCH goals by giving consumers meaningful, setting-specific quality-of-care data and encouraging hospitals to improve inpatient care quality for Medicare beneficiaries through transparent reporting and benchmarking against best practices. 

                                                                    Overall, the limited number of PPS-exempt cancer hospitals participating and reporting in this program makes it difficult to analyze overall performance trends. Based on the performance shown in Table 1, if all entities reporting performed at least at the average score, improving performance on this measure could help ensure that 11 fewer patients per entity contract CDI, potentially leading to better health outcomes.

                                                                    For this measure, Battelle reviewed the following publicly available datasets available at  Hospitals data archive | Provider Data Catalog:

                                                                    • Hospitals_02_2026.zip (which contains data from April 2024-March 2025 and is referred to as year 2024 in this assessment)
                                                                    • Hospitals_02_2025.zip (which contains data from April 2023-March 2024 and is referred to as year 2023 in this assessment)
                                                                    • Hospitals_01_2024.zip (which contains data from April 2022-March 2023 and is referred to as year 2022 in this assessment)
                                                                    • Hospitals_01_2023.zip (which contains data from April 2021-March 2022 and is referred to as year 2021 in this assessment)

                                                                    Battelle analyzed all values for “PCH_26” not marked as “Not Available” from the corresponding PCH_HEALTHCARE_ASSOCIATED_INFECTIONS_HOSPITAL.csv file.


                                                                    About Figure 1: Figure 1 is a boxplot that shows how scores have changed based on the most recent 4 years of data available. For each year, the boxplot displays a box with lines and dots to help visualize the range and distribution of scores. The dots represent the points where the lowest 5% and highest 5% of scores fall, and the line connecting them shows where 90% of the scores are located. The box itself covers the middle half of the scores, from the 25th to the 75th percentile. Inside the box, a horizontal line marks the median score, which is the middle value, while a “+” sign shows the average score. This type of graph makes overall trends in scores over time as well as the consistency and spread of the results easier to understand.

                                                                    Figure 1 (Measure Score by PY)
                                                                    boxplot


                                                                    Figure 1. Boxplot of Measure Score by Year

                                                                    Interpretation (Measure Score by PY)

                                                                    Figure 1 Interpretation: Overall, the limited number of PPS-Exempt Cancer Hospitals participating and reporting in this program makes it difficult to analyze overall performance trends. There are only 11 entities per year, so any apparent trend may just as likely be attributed to random error, indicating little discernible change across the 4 years. For this measure, a lower score indicates better quality of care.

                                                                    About this Analysis (Score Distro)

                                                                    About Table 1: Table 1 illustrates the distribution of scores (standardized infection ratios [SIRs]), raw rates, and the number of patients represented within each group. It is important to note that the groups (referred to as deciles, each comprising 10% of the organizations) with the lowest or highest scores may contain more or fewer patients than other groups. For example, if the lowest-scoring decile includes only 5% of the total patient population, then smaller entity size may be associated with lower performance scores.

                                                                    Table 1 (Score Distro)

                                                                    Table 1. Importance in the Most Recent Year of Data Available (Decile by Measure Score, FY2024) 

                                                                     OverallDecile 1Decile 2Decile 3Decile 4Decile 5Decile 6Decile 7Decile 8Decile 9Decile 10
                                                                    Average SIR (Standard Deviation)

                                                                    0.652 (0.552)

                                                                    0.225

                                                                    0.471

                                                                    0.311

                                                                    0.363

                                                                    0.374

                                                                    0.743

                                                                    0.641

                                                                    0.810

                                                                    2.167

                                                                    0.846

                                                                    Average Raw Rate (Standard Deviation)

                                                                    0.064 (0.040)

                                                                    0.026

                                                                    0.030

                                                                    0.038

                                                                    0.043

                                                                    0.043

                                                                    0.062

                                                                    0.089

                                                                    0.091

                                                                    0.105

                                                                    0.148

                                                                    Entities

                                                                    11

                                                                    2

                                                                    1

                                                                    1

                                                                    1

                                                                    1

                                                                    1

                                                                    1

                                                                    1

                                                                    1

                                                                    1

                                                                    Patients

                                                                    806,679

                                                                    325,898

                                                                    23,356

                                                                    10,608

                                                                    121,827

                                                                    170,519

                                                                    6,460

                                                                    17,922

                                                                    76,790

                                                                    6,681

                                                                    46,618

                                                                    Interpretation (Score Distro)

                                                                    Table 1 Interpretation: To estimate the number of negative outcomes (CDI), the number of patients is multiplied by the average raw rate for each decile. In 2024, the total estimated number of negative outcomes across all deciles is about 400. If the average performance of Decile 3 (0.311%) is considered a plausible, achievable rate, and the entities in Deciles 4 through 10 improved to reach that rate, about 120 fewer negative outcomes could occur. This translates to about 11 patients per entity and means that improving performance on this measure could help ensure that fewer patients contract CDI, potentially leading to better health outcomes.

                                                                      Importance Criterion Definition

                                                                      The Meaningfulness criterion will be evaluated as part of the full Preliminary Assessment available in September. 

                                                                        Criterion Definition

                                                                        This criterion will be evaluated as part of the full Preliminary Assessment available in September. 

                                                                          Criterion Definition

                                                                          This criterion will be evaluated as part of the full Preliminary Assessment available in September. 

                                                                          PA Type
                                                                          Performance and Impact Analysis (PIA)

                                                                          Clostridioides difficile (CDI) LabID Event Standardized Infection Ratio

                                                                          Annual risk-adjusted standardized infection ratio (SIR) of Clostridioides difficile (CDI) LabID events among adults and pediatrics hospitalized as inpatients at acute care hospitals, critical access hospitals, oncology hospitals, long-term acute care hospitals, and acute care rehabilitation hospitals. SIR is reported annually and is calculated by dividing the number of observed CDIs into the number of predicted CDIs.  

                                                                          CBE ID
                                                                          1717

                                                                          Continuity of Care After Inpatient or Residential Treatment for Substance Use Disorder

                                                                          The Continuity of Care After Inpatient or Residential Treatment for Substance Use Disorder measure evaluates the percentage of discharges from inpatient or residential treatment for diagnoses of substance use disorders (SUD) among Medicaid or Medicare-Medicaid beneficiaries, aged 18 years and older, which were followed by a treatment service for SUD.

                                                                          CBE ID
                                                                          3453